Peak-multiple compression, not peak earnings — yet.
Thesis
Bull case
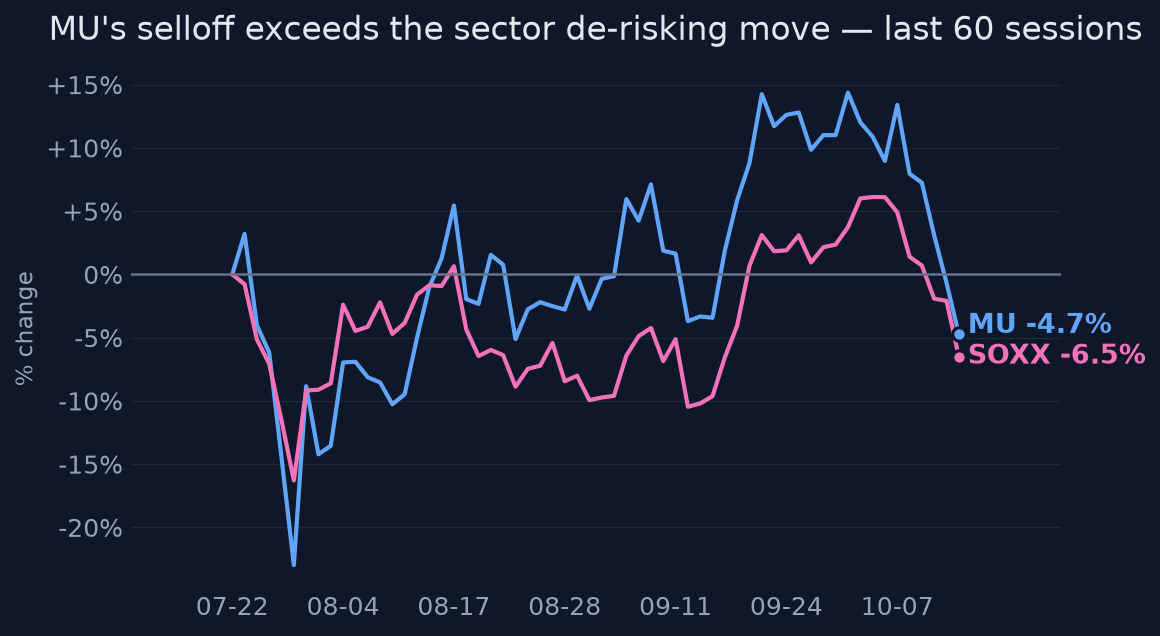
Five times forward earnings for a company whose next three quarters are contractually underwritten, with estimates still rising 28-to-2 and supply guided tighter through FY28. The selloff is ~two-thirds sector beta (SOXX -11%) plus a weakly-sourced China scare; CXMT capacity cannot affect HBM/advanced DRAM before 2028 at earliest. If Q4 pricing confirms +~20% and Q1 FY27 (reporting ~December) beats the $61.5B guide as Q4 did, the multiple re-rates toward even 7-8x, implying $1,230-1,410 (+35-55%).
Bear case
This is the classic cyclical trap: earnings peaks are marked by maximum estimate optimism, minimum multiples, and maximum capex — all present. Micron is spending ~$55B to build capacity that lands precisely when Morningstar models the downturn (2028-29), with depreciation that will compress margins through the trough; CXMT introduces a structurally new low-cost supplier into the next downcycle; and if AI-capex ROI skepticism (the actual driver of the October selloff) causes any hyperscaler order pause, the 25% of FY27 volume NOT contractually committed reprices instantly. Morningstar's $700 fair value is 23% below current price — and Morningstar-type normalized valuations have historically been right on memory.
What would change our mind
- Any sequential decline in DRAM contract prices in Q4 2026 or Q1 2027 (not deceleration — decline)
- Q1 FY27 revenue at or below the low end of guide ($60B) or gross margin guidance cut from ~86%
- Evidence that Strategic Customer Agreement commitments are being renegotiated or pushed out
- Verified CXMT HBM/advanced-DRAM qualification at a major customer before mid-2027
- FY28 EPS consensus beginning sustained downward revisions while FY27 still rises — the market pricing the cliff
Since publication vs SPY · closed horizons are frozen
The full research everything the view rests on
Direct answer to the question asked
Where the edge would come from
What the price assumes
The price embeds peak-cycle skepticism: a ~5-7x forward P/E vs. a 10-13x historical normalized range means the market assumes FY27 earnings of ~$176 are materially above mid-cycle and applies a trough multiple to peak earnings. Implicitly, consensus pricing assumes meaningful EPS normalization beginning around 2028 — i.e., the market is paying roughly Morningstar's framework (peak early 2028, downturn 2029) while sell-side targets cluster $1,250-1,900.
Why the market may be wrong
The market may be conflating rate-of-change deceleration with absolute decline. Server DRAM price increases slowed to 13-18% QoQ but remain strongly positive; >75% of FY27 volume is contractually locked, muting spot-market sensitivity; and HBM's 3-4x wafer intensity tightens conventional DRAM even as competitors expand. If the cycle peak is 2028 rather than 2027, four more quarters of upward revisions into a 5x multiple is a poor short. The risk is the market is right early — this exact pattern (falling stock, rising estimates) is textbook late-cycle behavior.
The one thing to watch
The variable that actually resolves the debate is not earnings — those are locked upward for 2-3 quarters — but DRAM contract price *direction* versus Micron's own capex trajectory: the ~$55B FY27 capex (construction landing late-2028) means Micron itself is building the glut that ends this cycle, so every quarter of current pricing strength is simultaneously raising future supply. Watch whether Q4 contract price increases hold ~20% QoQ; if they do while the stock stays 25% off highs, this is pure multiple compression and the asymmetry favors longs; the first negative sequential print flips the thesis to Morningstar's framework regardless of how good reported earnings look.
Key evidence (10)
- FY26 (ended Sept 3, 2026): revenue $133.2B vs $37.4B FY25; GAAP EPS $74.33; Q4 revenue $54.2B beat by 7.5%, gross margin ~87%, $44B operating cash flow [T1 SEC/IR]
- Q1 FY27 guidance $61.5B±1.5B revenue, EPS $38.15±1.00 — well above prior consensus $57B/$35.14 [T1 IR]
- FY27 consensus $275B revenue / $176.15 EPS; 28 EPS raises vs 2 cuts in last 30 days; FY28 $206.33 [T4 consensus aggregators]
- >75% of FY27 shipments committed via Strategic Customer Agreements; agreements covering >35% of revenue extend through 2030; supply-demand guided tighter through FY28 [T1 transcript]
- DRAM and NAND contract prices each +~20% QoQ in Q3 2026 with further Q4 increases expected; server DRAM decelerating to 13-18% QoQ but positive [T3/T4 industry reporting]
- FY27 capex ~$25B in H1 alone (Q1 ~$11.5B), implying ~$55B+ full year, construction-heavy, capacity landing late calendar 2028+ [T4 IR-derived]
- Morningstar cut fair value $850→$700, modeling peak ~early 2028 and sharp 2029 downturn [T3]
- Stock -16% in one week, -25% from $1,254.81 high; SOXX -11% same week; Bloomberg Oct 13: AI-trade cracks + CXMT technology advance fears [T2]
- Forward P/E ~5.2-7.0x vs 10-13x FY22-FY25 historical normalized range [T4]
- 20d realized vol at 6th percentile of trailing year; RSI 25.6 — compressed and oversold [computed]
Catalysts and risks
Catalysts
- Fiscal Q1 FY27 earnings (~mid-to-late December 2026): beat vs $61.5B/$38.15 guide and FY27 capex update
- Q4 2026 DRAM/NAND contract price settlements (Nov-Dec): continuation of ~20% QoQ or first deceleration below ~10%
- Hyperscaler 2027 capex guidance (Jan-Feb 2027 earnings season): AI-capex ROI narrative resolution
- Any CXMT capacity/technology verification — confirmation or debunking of the October shock
- Analyst target revisions: whether the $1,250-1,900 cluster holds or follows Morningstar down
Risks
- Cyclical peak risk: 5x forward P/Es on memory stocks have historically preceded 50%+ drawdowns when pricing turns (2018, 2022 analogs)
- ~$55B FY27 capex compresses near-term FCF and seeds 2028-29 oversupply with fixed depreciation
- CXMT/China supply shock is weakly sourced but, if real, changes the long-run industry structure
- Beta 2.2-2.6 with 80% 1y realized vol — position sizing must assume -40% drawdowns are normal
- Key consensus and capex figures rest on T4 aggregators, not primary filings
What to watch
- DRAM contract price trajectory (TrendForce/DRAMeXchange monthly prints) — direction, not magnitude
- December earnings: FY27 full-year capex number and any change to 'tighter through FY28' language
- Hyperscaler AI capex commentary in January — the demand-side assumption under everything
- Forward P/E vs estimate revisions: if estimates rise 10%+ while price stays flat, compression is nearing an extreme that historically resolves violently
- SOXX relative strength: MU's idiosyncratic thesis needs it to stop trading as a SOXX proxy (corr 0.83)
Market snapshot when the call was made 2026-10-14
Price
| Return 1w | -16.0% |
| Return 1m | -1.4% |
| Return 3m | +7.1% |
| Return 6m | +100.4% |
| Return 1y | +374.2% |
| From 52-week high | -24.7% |
| Realized vol, 20d | 50.6% |
| SPY 3m / 1y | +2.5% / +16.1% |
| QQQ 3m / 1y | +3.3% / +21.1% |
Technicals
MU technicals as of 2026-10-14: last close $914.13; 20d SMA 1,042.16 (bullish); 50d SMA 982.41; 12d EMA 1,010.80; 26d EMA 1,013.64; RSI 14 25.6 (oversold); 20d vol 46.4%; volume x1.0 vs 20d avg
Sources (30 · T1 = primary filings)
- T1https://www.sec.gov/Archives/edgar/data/723125/000072312526000018/a2026q4ex991-pressrelease.htm
- T4https://finance.yahoo.com/quote/MTE.HA/earnings/MTE.HA-Q4-2026-earnings_call-742832.html
- T4https://finance.yahoo.com/quote/MTE.DU/earnings/MTE.DU-Q4-2026-earnings_call-742832.html
- T4https://finance.yahoo.com/markets/stocks/articles/micron-making-smart-move-elon-141057805.html
- T4https://finance.yahoo.com/markets/stocks/articles/micron-stock-slips-despite-record-163243218.html
- T4https://finance.yahoo.com/quote/1MU.MI/earnings/1MU.MI-Q4-2026-earnings_call-742832.html
- T4https://finance.yahoo.com/quote/MU.VI/earnings/MU.VI-Q4-2026-earnings_call-742832.html
- T3https://www.cnbc.com/2026/09/30/micron-mu-q4-earnings-report-2026.html
- T4https://finance.yahoo.com/markets/stocks/articles/micron-blew-past-estimates-says-112008821.html
- T4https://finance.yahoo.com/markets/stocks/articles/microns-customer-contracts-just-took-081500174.html
- T4https://www.mt.co.kr/en/industry/2026/10/15/2026101514104825515
- T4https://www.mt.co.kr/index.php/en/industry/2026/10/15/2026101514104825515
- T4https://www.tradingkey.com/analysis/stocks/us-stocks/262215489-tsla-spacex-musk-spcx-mu-skhynix-hbm-ai-dram-tr…
- T4https://siliconanalysts.com/market
- T4https://siliconanalysts.com/earnings
- T4https://finance.yahoo.com/markets/stocks/articles/microns-blowout-q4-pushes-memory-090742260.html
- T2https://www.bloomberg.com/news/articles/2026-10-13/cracks-grow-across-the-ai-trade-as-memory-chip-stocks-tumbl…
- T4https://finance.yahoo.com/technology/ai/articles/cracks-grow-across-ai-trade-093845076.html
- T4https://finance.yahoo.com/markets/stocks/articles/taiwan-semiconductor-vs-asml-had-164559803.html
- T4https://www.nytimes.com/2026/10/13/business/technology-stocks-ai-nasdaq.html
- T4https://telecom.economictimes.indiatimes.com/news/internet/analysis-brutal-session-for-chip-stocks-shows-ai-tr…
- T4http://www.odaily.news/en/post/5213371
- T4https://finance.yahoo.com/technology/articles/global-chip-selloff-deepens-ai-085657296.html
- T3https://www.morningstar.com/news/dow-jones/202610131567/european-midday-briefing-chip-stocks-fall-as-global-ai…
- T3https://global.morningstar.com/en-ca/stocks/micron-earnings-beware-attempting-time-peak
- T3https://global.morningstar.com/en-gb/stocks/micron-what-we-think-stock-after-earnings
- T4https://news.futunn.com/en/post/1000472345/micron-s-earnings-call-75-of-its-2027-capacity-has
- T4https://www.theglobeandmail.com/investing/markets/stocks/MU/pressreleases/4938670/micron-earnings-call-highlig…
- T4https://edbutowsky.substack.com/p/same-profits-lower-price-why-we-prefer
- T4https://micron.gcs-web.com/static-files/9c0becf5-df56-4eec-bd67-453dda68b273
Earlier and later calls on MU
Want a fresh look at MU, or another name?
Queue a new deep-research run. Published to the feed when done.
Automated research opinion, published as-is on Oct 15, 2026. Not personalised advice. Figures use end-of-day closes.