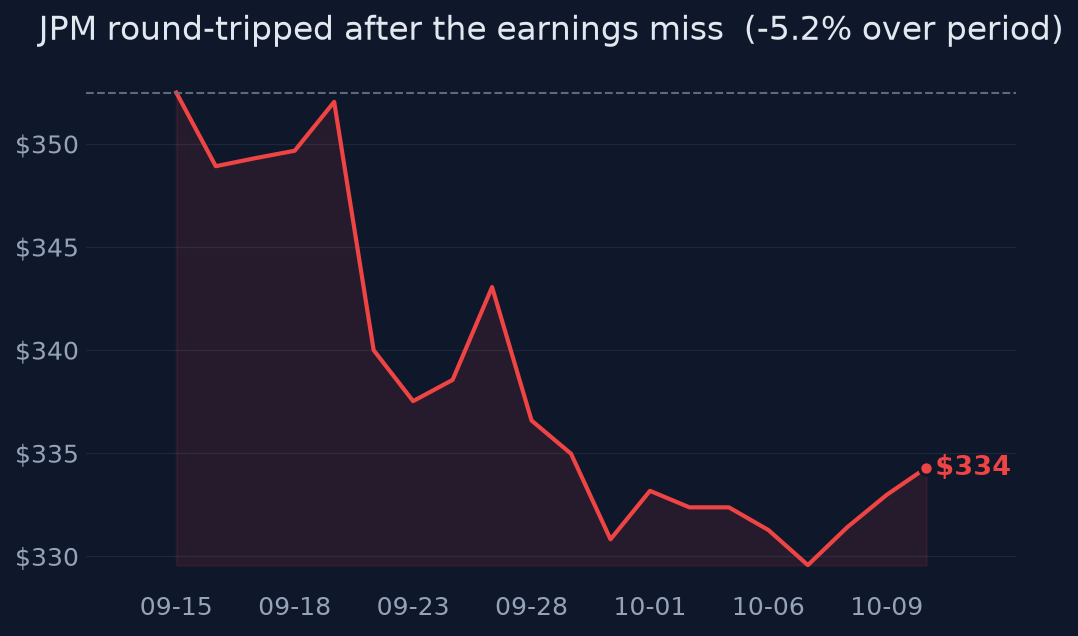
Reaction justified; miss is cosmetic.
Thesis
Bull case
The core franchise delivered: NII guidance raised twice this year, credit costs fell YoY, adjusted ROTCE is 21%, capital return capacity ($50B authorization) is enormous, and estimates were still rising into the print. If the rate selloff stabilizes — 10Y already off its 5.35% peak — the same higher rates become a pure NII tailwind, estimates hold ~$24-25, and a 13.6x premium multiple re-rates toward 15x, implying ~15-20% upside over 6 months. Compressed 20d vol (9th percentile) suggests the next big move could be up if Q4 confirms the raised guide.
Bear case
Adjusted EPS of $5.75 implies a ~$23 annualized pace vs ~$24-25 consensus, and management just raised expenses by $1.1B — the pattern of a bank whose cost growth is outpacing its revenue beat. The 5.2% 10Y is causing real damage (securities losses, BVPS decline, sector de-rating), more Fed hikes are priced, and Dimon himself warns risks are 'shifting under the surface.' Minimal Q3 buybacks ($664M) at these prices hint management sees better uses for capital — or risk ahead. A de-rating to 11-12x on downward estimate drift implies 10-15% downside.
What would change our mind
- Q4 shows expense guidance raised again or NII guidance cut — converts the 'optical miss' thesis into genuine deterioration
- Card NCOs break materially above 3.2% or reserve builds re-accelerate
- If FY27 EPS estimates (~$25.1) hold while the stock de-rates below ~12x, that confirms multiple compression, not fundamentals — the buying opportunity thesis activates
- 10Y sustained above ~5.5% with renewed BVPS declines would invalidate the 'rates as tailwind' framing
Since publication vs SPY · closed horizons are frozen
The full research everything the view rests on
Direct answer to the question asked
Where the edge would come from
What the price assumes
At ~13.6x forward EPS and ~2.5x book, the market prices JPM as the premium large bank delivering ~$24-25 FY26 EPS. Estimates were revised up ~5% over the prior 3 months, so the bar was elevated; the stock entered the print -6.2% over 1 month and -8.5% off highs, with the sector under rate-driven multiple compression (KBW regionals -11% from August peak).
Why the market may be wrong
Consensus may be over-indexing on the first-order NII benefit of higher rates while underpricing the second-order costs: the same 5%+ yield environment that lifted NII guidance also caused the securities loss, a QoQ BVPS decline, and sector de-rating — and markets are pricing further Fed hikes, which historically pressures bank multiples before it helps spreads. Conversely, if rate-driven fears prove overdone, JPM's raised core guidance and 21% adjusted ROTCE argue the current multiple is unjustifiably close to trough-sector levels.
The one thing to watch
Watch the expense line, not the EPS headline: the under-reported $1.1B expense guidance raise (to $108.6B) plus an adjusted quarterly EPS of $5.75 vs a ~$6.10 implied FY26 run-rate means either Q4 must accelerate sharply or estimates drift down — making Q4 expense/NII commentary, not credit, the falsifiable variable for the next 3-6 months.
Key evidence (11)
- Q3 2026 GAAP EPS $5.57 vs ~$5.90-5.93 consensus; revenue $50.9B vs ~$51.2B [T1 8-K/press release, 10/13/2026]
- Miss driven by $658M after-tax securities loss; ex-item EPS $5.75, adjusted ROTCE 21% [T1 presentation]
- FY26 NII guidance raised to $106.2B (from $105.5B); ex-markets NII to $97.2B [T1/T3 CNBC]
- FY26 expense guidance raised to $108.6B (from $107.5B) — the under-discussed negative [T3 CNBC]
- Credit benign: provision $2.74B vs $3.40B YoY; NCOs $2.2B, down YoY; reserve build only $539M vs $810M LY [T1]
- Stock fell ~3.9% to ~$321 premarket, then reversed to roughly flat mid-morning [T4 Yahoo/Seeking Alpha — intraday, unverified close]
- Peers diverged same day: GS beat massively (EPS $17.01 vs $12.86), WFC missed revenue — reaction was stock-specific, not sector verdict [T3 CNBC]
- Macro: 10Y ~5.20% (peaked ~5.35%, highest since ~2002); Fed at 3.75-4.00% with more hikes priced [T3 CNBC]
- Valuation ~13.6x forward, ~2.5x book ($334 vs BVPS $132.30, down QoQ); consensus FY26 EPS ~$24.1-25.0 (sources disagree) [T4 Yahoo/MarketWatch]
- FY26 EPS estimates revised up ~5% over 3 months into the print [T4 MarketWatch]
- Buyback ambiguity: $50B authorized July 2026 but only $664M repurchased in Q3; BVPS dipped QoQ [T1]
Catalysts and risks
Catalysts
- Q4 2026 earnings (mid-January 2027): does NII acceleration close the run-rate gap and does expense growth stabilize
- October and December FOMC meetings: a December hike is partially priced; a hawkish surprise extends sector de-rating
- 10Y Treasury path: sustained move above ~5.35% pressures BVPS and multiples; retreat toward 4.8% is a relief catalyst
- Any disclosure on buyback pace acceleration under the $50B authorization
- Card NCO trajectory vs the ~3.2% full-year guide
Risks
- Higher-for-longer rates cause further securities/AOCI losses and deposit-cost pressure, compressing NII ex-markets
- Expense growth above revenue growth (negative jaws) if the $108.6B guide slips again
- Credit normalization: card losses elevated at ~3.2% and Dimon flags under-the-surface risks; commercial credit improvement could reverse
- Estimate drift: FY26 consensus may be ~5% too high given the $5.75 adjusted quarterly run-rate
- Sector beta: 0.80 correlation with BAC and heavy XLF correlation limit idiosyncratic outperformance in a bank selloff
What to watch
- Q4 expense commentary and whether $108.6B FY26 guide holds
- NII ex-markets trajectory vs the raised $97.2B guide
- Buyback run-rate in Q4 — acceleration would signal management confidence at ~2.5x book
- 10Y yield and AOCI/BVPS direction
- December FOMC pricing
- Estimate revisions over the next 30 days: downward drift toward ~$23.5 FY26 confirms the run-rate concern
Market snapshot when the call was made 2026-10-12
Price
| Return 1w | +0.6% |
| Return 1m | -6.2% |
| Return 3m | -2.5% |
| Return 6m | +7.0% |
| Return 1y | +11.0% |
| From 52-week high | -8.5% |
| Realized vol, 20d | 17.2% |
| SPY 3m / 1y | +3.5% / +15.9% |
| QQQ 3m / 1y | +3.7% / +22.2% |
Technicals
JPM technicals as of 2026-10-12: last close $334.30; 20d SMA 338.57 (bearish); 50d SMA 349.79; 12d EMA 334.72; 26d EMA 339.98; RSI 14 40.8 (balanced); 20d vol 16.7%; volume x0.7 vs 20d avg
Sources (28 · T1 = primary filings)
- T1https://www.sec.gov/Archives/edgar/data/19617/000162828026065582/jpm-20261013.htm
- T4https://www.stocktitan.net/sec-filings/JPM/8-k-jpmorgan-chase-co-reports-material-event-6f03387f3670.html
- T4https://finance.yahoo.com/markets/stocks/articles/jpmorgan-chase-nyse-jpm-misses-110115410.html
- T4https://finance.yahoo.com/markets/stocks/articles/bull-case-jpmorgan-chase-jpm-111440194.html
- T4https://www.jpmorganchase.com/content/dam/jpmc/jpmorgan-chase-and-co/investor-relations/documents/quarterly-ea…
- T4https://www.tradingview.com/news/reuters.com,2026-10-13:newsml_RSM7854Ya:0-reg-jpmorgan-chase-co-jpmc-co-8-k-3…
- T4https://www.investors.com/news/jpmorgan-chase-goldman-sachs-earnings-wells-fargo-citigroup/
- T4https://sundayguardianlive.com/business/jpmorgan-earnings-prediction-jpm-stock-forecast-as-q3-2026-results-mis…
- T3https://www.cnbc.com/2026/10/13/bank-earnings-live-updates.html?msockid=2006525247c76b251e7b45a346486a99
- T4https://www.home.saxo/en-sg/content/articles/equities/us-bank-earnings-can-strong-profits-revive-confidence-13…
- T4https://www.investing.com/analysis/bank-earnings-q3-2026-goldman-30-beat-jpmorgan-misses-revenue-200689491
- T3https://www.cnbc.com/2026/10/13/bank-earnings-live-updates.html?ref=ouralpha.app
- T4https://ca.investing.com/analysis/bank-earnings-q3-2026-goldman-30-beat-jpmorgan-misses-revenue-200628534
- T4https://finance.yahoo.com/markets/stocks/articles/kbws-michaud-explains-expect-pressured-014726396.html
- T4https://finance.yahoo.com/markets/stocks/articles/zacks-analyst-blog-highlights-jpmorgan-092100156.html
- T4https://www.zerohedge.com/markets/jpm-reports-surprise-revenue-miss-and-eps-miss-guides-higher-net-interest-in…
- T4https://www.tradingview.com/news/seekingalpha:83d66ec14094b:0-jpmorgan-stock-recovers-after-q3-earnings-disapp…
- T4https://www.rttnews.com/3698469/jpmorgan-q3-net-profit-up-6-update.aspx
- T4https://getportfoliolens.com/insights/company-analysis/jpm-2026-10-03
- T4https://x.com/wallstengine/status/2109955773933449656
- T4https://investinglive.com/stocks/blackrock-cuts-us-stocks-to-neutral-and-buys-treasuries-as-10-year-yield-near…
- T4https://tradingeconomics.com/united-states/government-bond-yield
- T4https://www.zurich.com/-/media/Project/Zurich/Dotcom/economics-and-markets/docs/2026/investment-insights/inves…
- T3https://www.cnbc.com/2026/10/09/bank-stocks-selloff-q3-earnings.html
- T4https://www.perplexity.ai/finance/XLF
- T4https://www.tokenpost.com/news/investing/26756
- T4https://economictimes.indiatimes.com/topic/federal-reserve
- T4https://finance.yahoo.com/markets/stocks/articles/global-bank-stocks-sink-bond-092247931.html
Want a fresh look at JPM, or another name?
Queue a new deep-research run. Published to the feed when done.
Automated research opinion, published as-is on Oct 13, 2026. Not personalised advice. Figures use end-of-day closes.