Fundamentals yes; the setup is early.
Thesis
Bull case
Raised guidance, improving realized credit, a 3.7% yield, and resuming buybacks at 1.5x TBV create a favorable risk/reward floor; if the Fed stays paused and the curve stops flattening, the macro discount lifts sector-wide and USB's superior ROTCE (18.5%) and BTIG-driven fee diversification argue for re-rating toward the ~$68.50 mean target (~16% upside plus dividend). Falsifiable version: if FY27 EPS estimates hold near $5.85 while the stock stays below ~$60, this is multiple compression driven by rates, not earnings deterioration — and compression reverses when the rate path clarifies.
Bear case
The 'breakout' is a short-covering pop into 50-day SMA resistance within a sector downtrend caused by an unresolved inflation/rate problem (3.7% CPI, possible further tightening). Organic growth is ~6.4% once BTIG and securities effects are stripped, expenses are guided up ~8% in Q4, ROTCE is flat-to-down, the provision direction is up while realized losses improve (classic early-cycle-normalization pattern), and at 1.54x TBV the stock no longer has a deep-value cushion — a credit or rate scare re-rates it toward UBS's $64 or the $52.50 low target with little support.
What would change our mind
- Q4 2026 EPS or FY27 guidance comes in below consensus (~$5.85 FY27) — breaks the 'multiple compression, not deterioration' framing
- Net charge-offs reverse upward or nonperforming assets resume rising, or the reserve build is disclosed as CRE/office-specific and large
- ROTCE falls below ~17% or tangible book value per share declines, undermining the 1.54x TBV valuation anchor
- Buyback resumption is pushed out beyond mid-2027 without a capital rationale
- A decisive break below the 52-week-low region (~$45.50) on sector weakness — confirms the bounce was a momentum trap
Since publication vs SPY · closed horizons are frozen
No price data after the entry date yet.
The full research everything the view rests on
Direct answer to the question asked
Where the edge would come from
What the price assumes
At ~10.3x FY27 consensus EPS of ~$5.85 and 1.54x TBV, the market is pricing USB as a solid-but-ex-growth regional bank: it credits the earnings power but discounts macro/rate risk and doubts ROTCE can expand beyond ~18.5%. The ~10% discount to the 52-week high and the 3-month sector derating show investors are pricing the hot-CPI/higher-for-longer scenario, not company-specific deterioration.
Why the market may be wrong
Two ways. Bullishly: guidance was raised, credit is improving not normalizing upward, and buybacks resuming at 1.5x TBV are directly accretive — if the Fed stays on hold, the macro discount embedded in the multiple could unwind with no change in company fundamentals. Bearishly: the market may be right that organic momentum is weaker than headlines — organic revenue growth ex-BTIG and securities losses was ~6.4%, expenses are guided up ~8% in Q4, ROTCE is flat-to-ticking-down, and a forward-looking reserve build while realized losses improve suggests management sees something in the loan book the NCO data doesn't yet show.
The one thing to watch
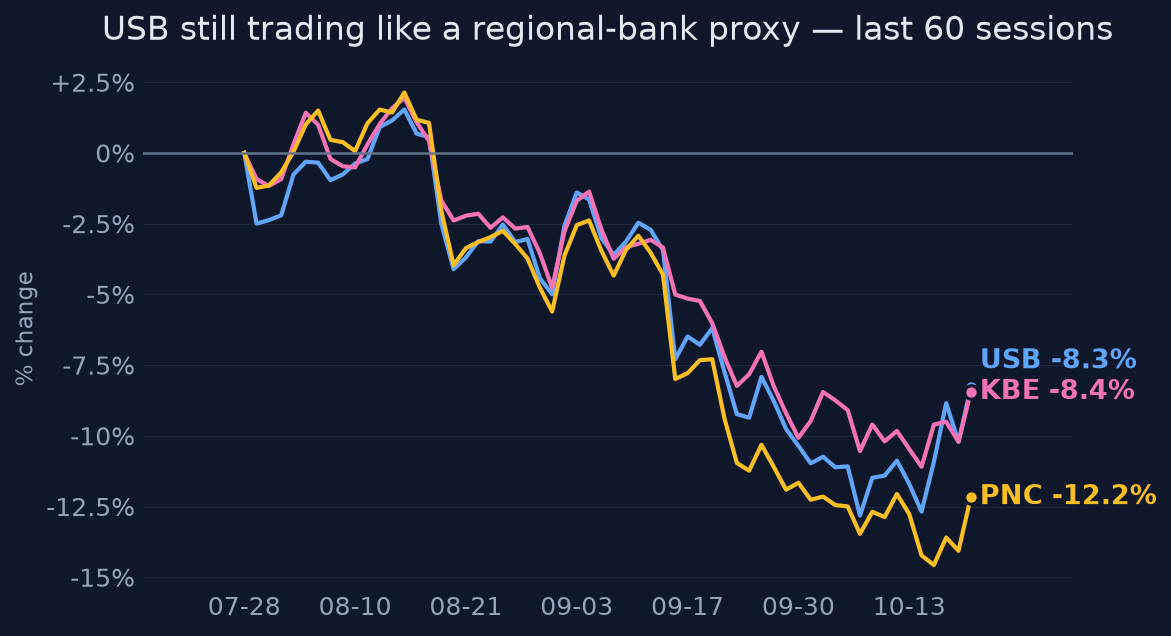
The scan is treating USB as an idiosyncratic breakout candidate, but with 60-day correlations of 0.83 to KBE and 0.89 to PNC, roughly 70-80% of its variance is sector beta — so the decision variable for the next 3-6 months isn't USB's Q4 print, it's the December FOMC and the CPI prints feeding it. Watch rates, not the tape; the company-specific evidence (raised guidance, buyback resumption, improving credit) is already known and hasn't been enough to decouple the stock.
Key evidence (8)
- Q3 2026 results (reported 2026-10-15, [T1] IR/SEC 8-K exhibit): EPS $1.34 vs ~$1.32 consensus; record revenue $7.97B +8.7% y/y; NIM 2.84% +5bps q/q; ~$0.07 EPS drag from a reserve build (ex-build y/y EPS growth ~16%)
- FY26 guidance raised: revenue growth to 8-9% from 5-7%; operating leverage to ~300bps (400bps ex-BTIG); Q4 guide NII +6-7%, fees +13-14% ([T1]/[T4] earnings coverage)
- Credit improving: net charge-offs 0.51% (-2bps q/q); nonperforming assets -1.6% q/q; CET1 10.8% stable ([T1] Q3 release)
- Valuation: ~$59.09 (2026-10-20), ~10.3-10.9x forward EPS (consensus FY26 $5.26-5.35, FY27 ~$5.85), 1.54x TBV ($38.27 TBVPS), ~3.7% dividend yield, ROTCE 18.5% (vs 18.7% Q2, 18.6% y/y — flat)
- BTIG closed June 2026, contributed $226M Q3 fee revenue; capital markets revenue +69% y/y; organic revenue growth ex-BTIG and securities losses ~6.4%
- Technicals: +3.9% last week vs SPY -1.2%, but 3m -8.3%, 9.7% below 52w high, price $59.09 below 50d SMA $60.60, RSI 57; 60d correlation to KBE 0.83, to PNC 0.89
- Sector context: KBE -7.2%, PNC -12.5% over 3 months; September CPI ran hot at 3.7%, end-2026 policy rate priced ~4.1% — the stated driver of the regional-bank derating
- Management: buybacks expected to resume within 1-2 quarters; committed to 70-75% total payout; analyst mean target ~$68.50 (UBS cut to $64 Neutral on 2026-10-05; Raymond James raised to $72 on 2026-10-06)
Catalysts and risks
Catalysts
- Q4 2026 earnings (~mid-January 2027): first clean read on ex-BTIG run-rate, NIM trajectory, and whether the reserve build repeats
- December 2026 FOMC and intervening CPI prints: the dominant driver of regional-bank multiples; end-2026 rate currently priced ~4.1%
- Formal buyback restart announcement (guided within 1-2 quarters) and any new authorization
- Any termination of outstanding OCC/CFPB/Fed consent orders — status unconfirmed in this research; termination would be an unpriced positive
- Q3 10-Q filing: detail on the reserve-build driver, CRE/office migration, and BTIG purchase accounting
Risks
- Rate/macro: hot CPI forces further tightening or curve flattening, renewing the sector derating that has dominated USB's tape (0.83-0.89 correlation to KBE/PNC)
- Reserve build is the leading edge of credit normalization — driver undisclosed in available summaries; CRE/office exposure unquantified in this research
- BTIG integration: personnel retention, synergy realization, and risk-control execution in a capital-markets business USB hasn't run before; up to $275M contingent consideration still outstanding
- Expense growth (~8% Q4 guided) absorbs revenue gains, efficiency ratio stalls, ROTCE stays flat and caps the multiple
- Regulatory: consent-order status unverified; no termination confirmed — assumption of resolution would be unfounded
What to watch
- December FOMC decision and dot path; monthly CPI prints relative to the 3.7% September reading
- USB price action at the 50-day SMA (~$60.60): reclaim and hold vs rejection — the technical confirmation the scan lacks
- FY27 consensus EPS revisions: rising estimates with a flat stock = genuine compression; falling estimates = the trap
- Q4 10-Q/earnings supplement: CRE and office criticized-loan migration, provision detail
- Formal buyback announcement and size; any consent-order termination notices from OCC/CFPB/Fed
- KBE/relative performance: if USB stops tracking KBE on down days, the idiosyncratic thesis is gaining traction
Market snapshot when the call was made 2026-10-20
Price
| Return 1w | +3.9% |
| Return 1m | -2.2% |
| Return 3m | -8.3% |
| Return 6m | +4.0% |
| Return 1y | +29.3% |
| From 52-week high | -9.7% |
| Realized vol, 20d | 21% |
| SPY 3m / 1y | +2.9% / +15.8% |
| QQQ 3m / 1y | +1.7% / +18.8% |
Technicals
USB technicals as of 2026-10-20: last close $59.09; 20d SMA 57.71 (bearish); 50d SMA 60.60; 12d EMA 57.86; 26d EMA 58.57; RSI 14 57.4 (balanced); 20d vol 20.1%; volume x0.9 vs 20d avg
Verifier notes PASS
Corrections applied
- Minor arithmetic note (non-material): market_expectation states '~10.3x FY27 consensus EPS of ~$5.85', but $59.09 / $5.85 = ~10.1x. The 10.3x figure matches the evidence's provider-reported forward P/E (likely on a different quote/EPS basis); suggest writing '~10x FY27 consensus EPS of ~$5.85' or attributing 10.3x to the provider quote. All other figures (EPS $1.34 vs $1.32, revenue $7.97B +8.7%, NIM 2.84%, NCOs 0.51%, NPAs -1.6%, CET1 10.8%, ROTCE 18.5/18.7/18.6%, 1.54x TBV on $38.27, 3.7% yield, correlations 0.83/0.89, 3m returns -8.3%/-7.2%/-12.5%, CPI 3.7%, end-2026 rate ~4.1%, targets $68.50/$64/$72/$52.50, BTIG $226M/$275M, ~16% implied upside = 68.50/59.09-1) check against the evidence; sector-variance claim (R² of 0.83-0.89 ≈ 69-79%) is sound arithmetic; LEAN_BULLISH at conviction 5 is band-consistent; unverified items (reserve-build driver, consent orders, CRE detail) are properly flagged as gaps rather than asserted.
Sources (30 · T1 = primary filings)
- T4https://www.usbank.com/about-us-bank/news-and-stories/article-library/us-bancorp-reports-third-quarter-2026-re…
- T1https://ir.usbank.com/news-events/news/news-details/2026/U-S--Bancorp-Reports-Third-Quarter-2026-Results/defau…
- T1https://www.sec.gov/Archives/edgar/data/36104/000119312526011142/d37749dex991.htm
- T4https://www.investing.com/news/transcripts/earnings-call-transcript-us-bancorp-tops-eps-forecasts-in-q3-2026-9…
- T4https://www.mitrade.com/en/articulo/news/live-news/article-0-2167159-20261016
- T4https://earningscall.biz/e/nyse/s/usb/y/2026/q/q3
- T4https://www.mitrade.com/insights/news/live-news/article-0-2167159-20261016
- T4https://www.stocktitan.net/sec-filings/USB/8-k.html
- T4https://www.perplexity.ai/finance/PNC?comparing=PNC,JPM,WFC,USB,KEY,EWBC
- T4https://finance.yahoo.com/quote/USB/earnings/USB-Q3-2026-earnings_call-651769.html
- T4https://www.perplexity.ai/finance/USB?comparing=USB,PNC,MTB,COF,WFC,JPM
- T1https://investor.pnc.com/news-events/financial-press-releases/detail/700/pnc-reports-third-quarter-2026-net-in…
- T4https://www.perplexity.ai/finance/PNC?comparing=PNC,BAC,WFC,C,USB,JDO.AX
- T4https://www.perplexity.ai/finance/USB?comparing=USB,BAC,C,WFC,PNC,JDO.AX
- T1https://www.federalreserve.gov/monetarypolicy/beigebook202610-summary.htm
- T4http://www.perplexity.ai/finance/PNC?comparing=PNC,USB,MTB,JPM,WFC,C
- T4https://www.marketbeat.com/stocks/NYSE/USB/forecast/
- T4https://www.marketbeat.com/stocks/NYSE/USB/
- T4https://www.perplexity.ai/finance/USB/analysis
- T4https://www.perplexity.ai/finance/USB?comparing=USB,MS,TD,TFC,PNC,RY
- T4https://stockanalysis.com/stocks/usb/
- T4https://www.marketscreener.com/news/us-bancorp-2026-q3-earnings-press-release-ce785dd3da80f520
- T4https://stockanalysis.com/stocks/usb.pra/
- T4https://public.com/stocks/usb/forecast-price-target
- T4https://finance.yahoo.com/markets/stocks/articles/u-bancorp-reports-10-rise-140133225.html
- T4https://www.investing.com/news/company-news/us-bancorp-q3-2026-slides-record-revenue-raised-guidance-93CH-4952…
- T4https://uk.investing.com/news/stock-market-news/us-bancorp-q3-2026-slides-record-revenue-raised-guidance-93CH-…
- T4https://finance.yahoo.com/markets/stocks/articles/u-bancorp-q3-earnings-beat-165100386.html
- T4https://www.tradingkey.com/news/transcripts/262219388-tradingkey
- T4https://ng.investing.com/news/stock-market-news/us-bancorp-q3-2026-slides-record-revenue-raised-guidance-93CH-…
Want a fresh look at USB, or another name?
Queue a new deep-research run. Published to the feed when done.
Automated research opinion, published as-is on Oct 21, 2026. Not personalised advice. Figures use end-of-day closes.