No clear edge yet.
Thesis
Bull case
Q3 2026 comes in at or above $660M+ with Q4 guidance implying a return to positive YoY growth, proving the miss was CPG/auto cyclicality plus fixable execution issues. The stock then re-rates from a melting-ice-cube multiple: even a stagnant ~$0.90-1.00 EPS business at a market multiple with $1.5B net cash and an accelerated buyback at $12 implies 50-100% upside (the street's own 'Reduce'-rated target is ~$19). Audience Unlimited's H2 2026 open beta, UID2 expansion, 200+ joint business plans (+38% YoY), and double-digit CTV/audio/international growth are the seeds of re-acceleration — and the $1.5B cash pile lets the company buy back ~27% of its market cap at depressed prices if management acts rationally.
Bear case
The miss is the first visible symptom of structural erosion: Amazon DSP (commerce data + Prime Video + Fire TV), Google's YouTube/DV360 stack, and agentic AI that devalues the DSP interface are pulling the highest-value budgets inside vertically integrated ecosystems, leaving TTD with fragmented open-internet supply. If so, Q3 misses the floor or Q4 guides to a second YoY decline, EPS estimates (already cut 61-78%) fall further, EBITDA margins keep compressing (34% → ~25% guided), and the 'cheap' 8.7x forward P/E proves to be a value trap on declining E. Management credibility — already damaged by missing its own floor and by buying back $1.4B at $52.60 — means each subsequent guide gets a lower benefit of the doubt.
What would change our mind
- For the bearish/no-edge stance: Q3 revenue beats $665M+ AND Q4 guidance implies a return to positive YoY growth AND buyback accelerates materially — this combination would make the risk/reward clearly asymmetric long
- For any bullish value stance: Q3 revenue below $650M, OR Q4 guidance implying a second consecutive YoY decline, OR EBITDA margin guided below ~22% — confirms structural deterioration and that the multiple is cheap on the wrong E
- For the 'balance sheet floor' assumption: FCF turning negative or cash being deployed into a large dilutive acquisition rather than buybacks at depressed prices
Since publication vs SPY · closed horizons are frozen
No price data after the entry date yet.
The full research everything the view rests on
Direct answer to the question asked
Where the edge would come from
What the price assumes
At ~8.7x forward earnings with EV of ~$4.1B against $500M+ annualized FCF, the market is pricing TTD as a melting ice cube — roughly a no-growth or declining terminal business. Notably, even the bearish consensus (average rating 'Reduce') carries a ~$19 price target, ~58% above the current price, which reveals the market's real assumption is not terminal collapse but prolonged stagnation with further estimate cuts. Consensus revenue sitting exactly at the $650M Q3 floor means the market already expects the company to barely make — or miss — its own lowered bar.
Why the market may be wrong
In the bullish direction: if Q3 is a one-off execution reset, a ~$4.1B EV for a business with 34% EBITDA margins last quarter, double-digit CTV/audio/international growth, and $500M+ FCF is priced for a deterioration that may not materialize — the 61-78% EPS estimate cuts may have overshot. In the bearish direction: if agentic AI and Amazon's closed-loop commerce data are genuinely structurally eroding the independent DSP model, even collapsed EPS estimates may still be too high, and the 'cheap' 8.7x P/E is cheap on the wrong E. The evidence currently cannot distinguish these; the November print and Q4 guide are the first real tests.
The one thing to watch
Stop watching the multiple and the buyback — the single variable that resolves this is whether Q4 2026 guidance implies a return to positive YoY revenue growth, because the double-digit-growing segments (CTV, audio, international at ~17% of revenue, China +100% YTD) must now offset CPG/auto weakness for the thesis to survive; a second consecutive guided YoY decline would confirm structural share leakage regardless of how cheap the stock looks, while 20-day realized vol at the 4th percentile of its own year heading into a binary print means the current dead-calm tape is coiled, not stabilized.
Key evidence (10)
- FY2025 (SEC XBRL): revenue $2.90B (+18.5% YoY), operating margin 20.3%, diluted EPS $0.90 — business was healthy as recently as last year [T1]
- Q2 2026 (8-K, Aug 6, 2026): revenue $715M (+3% YoY), ~$35M below management's own $750M floor; adj. EBITDA $241M (34% margin); stock fell ~22% on Aug 7 [T1]
- Q3 2026 guidance: revenue 'at least $650M' vs $739.4M in Q3 2025 — implied ~12% YoY decline; adj. EBITDA ~$160M (margin compressing 34% → ~25%); consensus ~$651M sits at the floor [T1/T4]
- EPS revisions collapsed over 3 months (one aggregator: 2026 consensus $1.00 → $0.39, -61%; 2027 $1.20 → $0.26, -78%) — but aggregators conflict wildly on levels ($1.16 vs $0.39 for 2026), so treat levels as unreliable [T3/T4]
- Balance sheet (Q2 2026): ~$1.5B cash + ST investments, no material debt; Q2 FCF $136M; EV ≈ $4.1B → EV/FCF ~8x [T1]
- Buyback credibility issue: TTD spent ~$1.4B repurchasing stock in 2025 at an average of ~$52.60 — over 4x today's price; only ~$78M repurchased in Q2 2026 with ~$269M authorization remaining [T1]
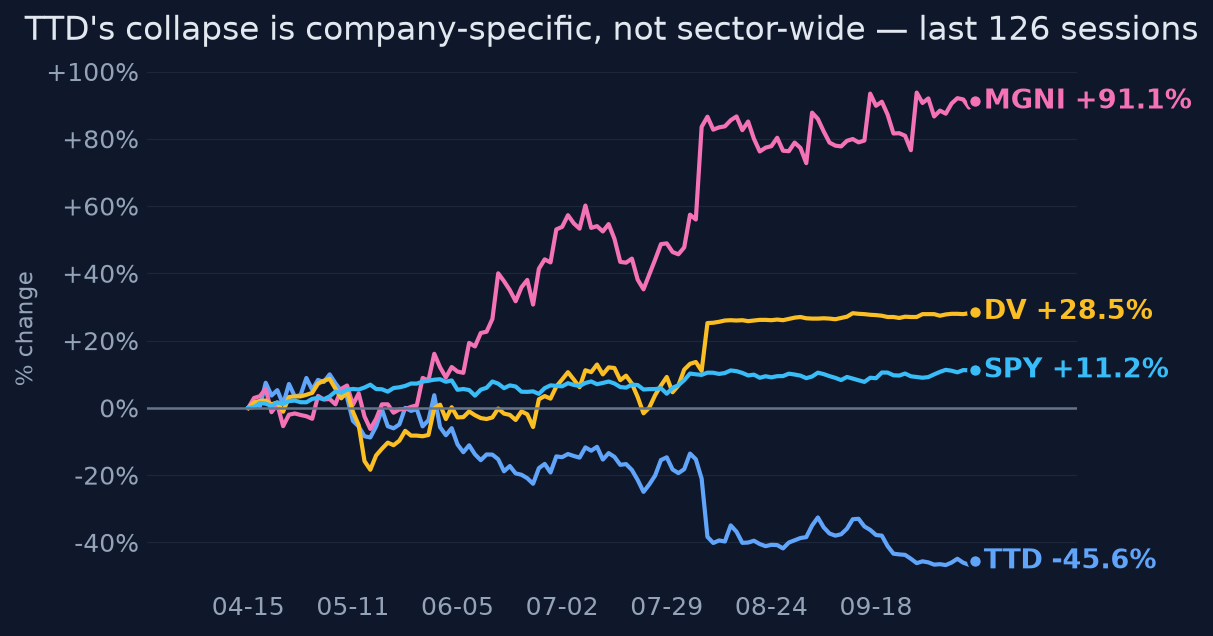
- Idiosyncratic collapse confirmed: 1yr SPY correlation 0.18, idiosyncratic share ~99%; Magnite +103%/6m, DoubleVerify +34%/6m, SPY +19%/1yr [computed from price history]
- 20-day realized vol at the 4th percentile of its own trailing year — unusual compression immediately before earnings [computed]
- Competitive threat is real but unquantified: Amazon ad revenue $17.2B in Q1 2026 with first-party commerce data + Prime Video inventory; no reliable 2026 share data exists to prove or disprove TTD share loss [T2/T3, qualitative]
- Management continuity signal: new CFO Nate Olmstead (joined July 2026) stated 'really no change in the approach to guidance' — weak guidance is not a transition artifact [T4 transcript]
Catalysts and risks
Catalysts
- Q3 2026 earnings, expected ~November 5, 2026 (date per T4 aggregator, not formally confirmed) — revenue vs $650M floor and adj. EBITDA vs ~$160M guide
- Q4 2026 / initial FY2027 guidance (~Feb 2027) — the decisive test: positive vs negative implied YoY growth
- Buyback pace disclosed in Q3 10-Q and any new authorization — a large acceleration at $12 would signal management confidence; token buying would signal the opposite
- Audience Unlimited open beta adoption metrics (H2 2026) and any disclosed revenue contribution
- Analyst revision direction post-print — estimates have been falling 20%+ per month; stabilization is a prerequisite for any re-rating
- Potential CTV/retail-media competitive data points (Amazon Ads quarterly growth, agency commentary) that would make the share-leakage question quantifiable
Risks
- Binary event risk: consensus sits at the guidance floor with vol at the 4th percentile — a Q3 miss or weak Q4 guide could gap the stock sharply lower
- Estimate-revision momentum is still strongly negative; catching a falling knife before revisions stabilize is historically a losing trade
- Structural share-leakage thesis is unquantified — if real, it compounds and the floor from the balance sheet erodes as FCF declines
- Guidance credibility is damaged: management missed its own floor within the quarter and has a poor capital-allocation track record ($1.4B at ~$52.60 avg)
- CPG and auto ad weakness may be macro-driven and worsen rather than recover
- Consensus data quality is poor (aggregators conflict by ~3x on EPS levels), so 'cheapness' metrics carry wide error bars
What to watch
- Q3 print vs the $650M floor and, more important, the Q4 guide's implied YoY growth rate — the single resolving variable
- CPG/auto commentary: stabilization vs continued deterioration; whether 'internal execution issues' are specifically explained and remediated
- CTV and international growth rates relative to Amazon's ad revenue growth — the relative differential is the only available proxy for share gain/loss
- Q3 buyback dollar volume and remaining authorization (10-Q) — does management buy aggressively at $12 the way it did at $52?
- Analyst revision breadth in the 30 days post-print — breadth turning positive matters more than the level
- Any evidence Audience Unlimited/UID2 is measurably winning budgets vs walled gardens (JBP growth, data marketplace revenue)
Market snapshot when the call was made 2026-10-13
Price
| Return 1w | +2.1% |
| Return 1m | -18.7% |
| Return 3m | -37.2% |
| Return 6m | -42.1% |
| Return 1y | -76.8% |
| From 52-week high | -77.5% |
| Realized vol, 20d | 30.3% |
| SPY 3m / 1y | +3.1% / +19.1% |
| QQQ 3m / 1y | +3.6% / +26.1% |
Technicals
TTD technicals as of 2026-10-13: last close $12.17; 20d SMA 12.64 (bearish); 50d SMA 13.66; 12d EMA 12.28; 26d EMA 12.86; RSI 14 37.9 (balanced); 20d vol 28.6%; volume x0.6 vs 20d avg
Sources (23 · T1 = primary filings)
- T4https://investors.thetradedesk.com/financials/sec-filings/
- T1https://www.sec.gov/Archives/edgar/data/1671933/000167193326000085/ttd-20260806x8kexx991.htm
- T4https://investors.thetradedesk.com/financials/sec-filings/default.aspx?page=1
- T1https://www.sec.gov/Archives/edgar/data/1671933/000167193326000009/ttd-20260225x8kexx991.htm
- T4https://www.stocktitan.net/sec-filings/TTD/8-k-trade-desk-inc-reports-material-event-a749d4b00894.html
- T4https://simplywall.st/stocks/us/media/nasdaq-ttd/trade-desk
- T4https://www.marketbeat.com/earnings/reports/2026-11-5-the-trade-desk-inc-stock/
- T4https://finance.yahoo.com/markets/stocks/articles/trade-desk-stock-down-68-095103537.html
- T4https://www.aboutamazon.com/news/company-news/andy-jassy-amazon-ads-q1-2026-earnings
- T4https://news.futunn.com/en/post/1000967890/trade-desk-q2-2026-earnings-call-complete-transcript
- T4https://www.investmoat.com/stocks/ttd
- T4https://www.thetradedesk.com/press-room/the-trade-desk-reports-second-quarter-2026-financial-results
- T4https://adwave.com/resources/ctv-advertising-2026-update
- T4https://m.media-amazon.com/images/G/01/AdProductsWebsite/images/whats-new/IDC_The_Race_to_Build_an_Advertiser-…
- T4https://scanx.trade/stock-market-news/companies/trade-desk-q2fy26-results-revenue-up-3-715-million-ebitda-marg…
- T4https://adwave.com/resources/ctv-advertising-forecast-2026
- T4https://www.thetradedesk.com/openttd/hightouch-id-express-uid2-activation
- T4https://www.benzinga.com/news/26/10/62314815/trade-desk-q2-2026-earnings-call-complete-transcript
- T4https://www.stocktitan.net/financials/TTD/
- T4https://www.thetradedesk.com/jp/resources/audience-unlimited-expanding-access-to-high-relevance-third-party-da…
- T4https://www.stocktitan.net/overview/TTD/
- T4https://www.zacks.com/stock/news/2978331/trade-desks-weak-q3-outlook-raises-concerns-whats-ahead
- T4https://stockanalysis.com/stocks/ttd/transcripts/662712-q2-2026/
Want a fresh look at TTD, or another name?
Queue a new deep-research run. Published to the feed when done.
Automated research opinion, published as-is on Oct 14, 2026. Not personalised advice. Figures use end-of-day closes.