Real activity, but priced ahead of it.
Thesis
Bull case
NEAR is the cleanest listed AI-agent infrastructure play at the exact moment an AI-crypto rotation (+54% sector in Sept) is underway; it now has a U.S. spot ETF channel, falling issuance (2.5%→1.6% pending), a fee-burn upgrade live, and a buyback flywheel that grows mechanically with Intents adoption — if Intents 30d volume ($4B, +896% YoY) keeps compounding, the currently trivial holder revenue inflects non-linearly and today's valuation gets rationalized by growth.
Bear case
The token captures ~0.016% of routed Intents volume as holder value; L1 revenue is <$1M/yr against a $7.4B cap; TVL growth is a price-denomination illusion; ETF inflows (~$71M) are a one-time launch effect already in the price; and 40%-of-mcap leveraged longs in an 86th-percentile vol regime mean any narrative wobble (Oct 9-style AI selloff, another exploit, failed inflation vote) triggers a 30-50% unwind toward the 50d SMA (~$3.4), consistent with the token's own -68% 1y max drawdown history.
What would change our mind
- Verified NRR daily flows showing sustained >$10M/week net inflows beyond 60 days post-launch
- Intents-attributed holder revenue/buybacks reaching >$3M per month (vs $3.5M cumulative to Sept 4)
- NEAR-denominated TVL (not USD) rising >30% over 90 days, proving real adoption
- Inflation taper to 1.6% confirmed passed and activated
Since publication vs BTC · closed horizons are frozen
The full research everything the view rests on
Direct answer to the question asked
Where the edge would come from
What the price assumes
At 52-week highs with 95% bullish community sentiment, price assumes the AI-rotation continues, NRR ETF inflows persist well beyond the launch pop, the 1.6% inflation proposal passes, and Intents buybacks scale from ~$5M/yr to something an order of magnitude larger.
Why the market may be wrong
The market may be conflating Intents gross volume with value capture — $33B routed yielded only ~$5.3M captured revenue. TVL growth (+97%/30d) is likely a price artifact (flat-to-down in NEAR terms, unverified). Meanwhile 40%-of-mcap perp OI means a narrative crack (like the Oct 9 AI sector -5% day, or another Intents exploit) can trigger cascading long liquidations in a token whose realized vol is already at the 86th percentile.
The one thing to watch
Stop watching NEAR Intents volume — watch the buyback line: cumulative Intents volume grew >30x in a year while value accruing to holders was only ~$3.5M total; the variable that decides whether this repricing sticks is whether monthly Intents-attributed holder revenue crosses into tens of millions, not whether routed volume keeps setting records.
Key evidence (9)
- Price +130.6%/1m, +301%/6m to $5.63 at 52w high; 1m move is 2.7σ vs own history; 20d vol 148.6% (86th pct) (CoinGecko, 2026-10-11)
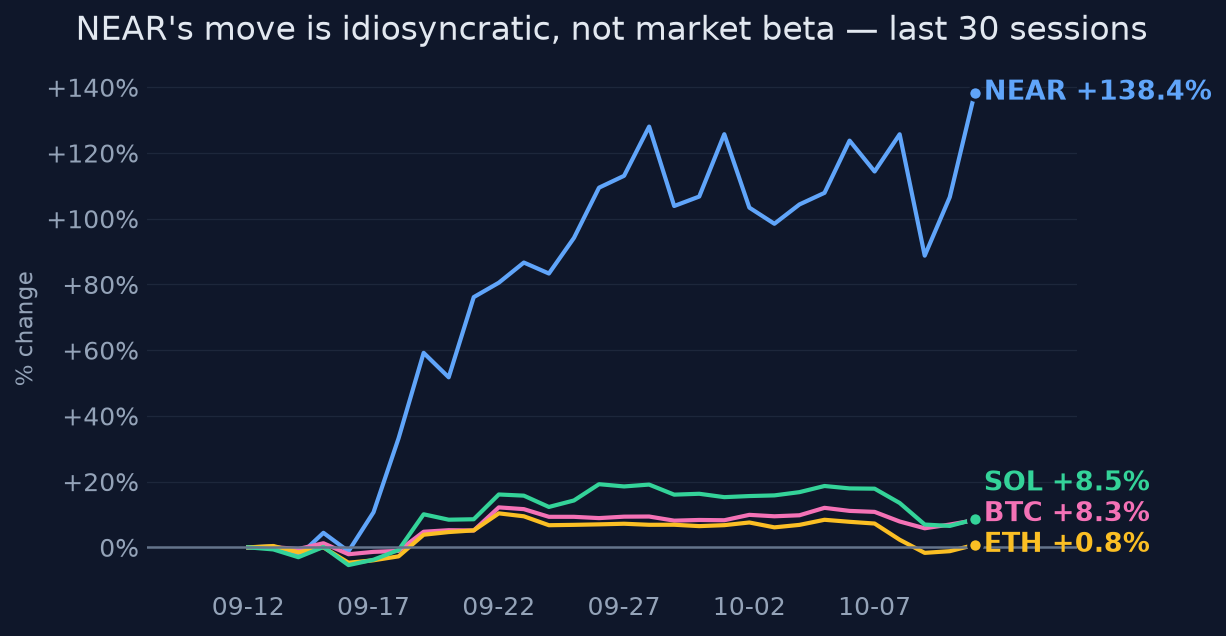
- Idiosyncratic share 85% vs BTC, 82% vs ETH; BTC/ETH/SOL roughly flat over the same month — this is alpha/narrative, not beta (computed from daily history)
- 24h volume $891M = 12.1% of $7.38B mcap — rules out thin-liquidity noise (CoinGecko, 2026-10-11)
- Bitwise NRR spot ETF launched NYSE Arca Sept 29, 2026 (confirmed by Bitwise); reported ~$71.4M cumulative inflows by Oct 9 [secondary/SoSoValue, unverified by issuer or Farside]
- Chain fundamentals anemic: TVL $269M (mcap/TVL 27.5x), 30d fees $163K, FDV/annualized revenue ~5,300x (DefiLlama, 2026-10-11)
- Intents: >$33B cumulative volume, >$4B 30d (+896% YoY); but $27.1B swaps → only $44.5M fees, $5.3M captured revenue, $3.5M to holders as of Sept 4, 2026 (DefiLlama-cited reporting)
- Perp OI ~$2.88B ≈ 40% of market cap, OI and net-long delta rising; funding positive but not extreme [T4 snapshot]
- Oct 1, 2026 Intents exploit: $3.8M lost, patched in ~1h, fully recovered by Oct 2; base chain unaffected — but execution risk in the flagship product
- Inflation cut 5%→2.5% (Oct 2025); proposal to taper to 1.6% over 24 months (~Oct 7-11, 2026, passage unconfirmed); HSP-027 (~Oct 5) makes 100% of gas fees burned; supply fully unlocked
Catalysts and risks
Catalysts
- Governance vote/outcome on inflation taper 2.5%→1.6% (discussed ~Oct 11, 2026)
- HSP-027 fee-burn activation effects becoming visible in burn data (post ~Oct 5, 2026)
- Daily NRR ETF flow data — persistence vs fade of inflows after launch month
- Monthly Intents volume and, critically, Intents-attributed buyback/holder revenue prints
- NEP-655 mainnet launch (reported 'within weeks')
- AI-sector rotation continuation or reversal (sector already showed -5% single-day fragility on Oct 9)
Risks
- Long squeeze: $2.8B perp OI (~40% of mcap) unwinding in a high-vol regime
- Narrative beta: AI basket trades as high-beta group; sector selloffs hit NEAR hardest as the outperformer
- Value-capture gap: Intents volume growth may continue without meaningful revenue accruing to NEAR
- Execution risk in Intents (Oct 1 exploit) in the product carrying the narrative
- ETF flow figures unverified — actual inflows could be weaker than reported $71.4M
- Mean reversion: 162% above 200d SMA with RSI 64 and price at top of 20d range
What to watch
- Monthly Intents buyback/holder-revenue line, not headline volume
- Farside/issuer-verified NRR ETF flow series
- Perp OI as % of mcap — a drop below ~25% via price decline vs orderly deleveraging
- Outcome of the 1.6% inflation governance proposal
- TVL in NEAR terms to separate adoption from price artifact
- AI-sector basket breadth (TAO, FET, RENDER) as a leading indicator for NEAR
Market snapshot when the call was made 2026-10-11
Price
| Return 1w | +16.7% |
| Return 1m | +130.6% |
| Return 3m | +201.8% |
| Return 6m | +301.4% |
| Return 1y | +136.3% |
| From 52-week high | +0.0% |
| Realized vol, 20d | 148.6% |
| BTC 3m / 1y | +31.1% / -26.0% |
| ETH 3m / 1y | +41.8% / -34.0% |
| QQQ 3m / 1y | +5.5% / +22.9% |
Technicals
Verifier notes PASS
Unsupported claims
- Bear case: 'The token captures ~0.016% of routed Intents volume as holder value' — the arithmetic 0.016% comes from $5.28M captured revenue / $33B cumulative volume, which is captured revenue, not holder value. Using the actual holder figure ($3.51M) against routed volume ($27.1B swaps or $33B total) gives ~0.011–0.013%. The mislabeled figure slightly overstates value capture in a section arguing value capture is trivial.
- Market expectation: buybacks scaling 'from ~$5M/yr' — no annualized buyback rate appears in the evidence; it is inferred from $3.5M cumulative holder revenue since Feb 23, 2026 (which would annualize closer to ~$6.5M/yr). The opinion presents it as if it were a reported run-rate without flagging it as a derived estimate.
Corrections applied
- Change '~0.016% of routed Intents volume as holder value' to '~0.01–0.013%' (computed from $3.51M holder revenue / $27.1B–$33B routed volume), or relabel the 0.016% figure as captured-revenue share rather than holder value.
- Qualify '~$5M/yr' Intents buybacks as an estimate derived from $3.5M cumulative holder revenue over ~6.5 months, or restate as 'single-digit $M/yr'.
Sources (24 · T1 = primary filings)
- T4https://www.odaily.news/en/newsflash/523408
- T3https://coinmarketcap.com/top-stories/6ac8f473dd67e817b910ef3c/
- T4https://pintu.co.id/en/academy/post/token-unlocks-and-crypto-catalysts-in-october-2026
- T4https://crypto.news/best-ai-cryptocurrencies-to-buy-in-october-2026-five-working-theses/
- T4https://www.21shares.com/en-us/insights/bitcoin-outlook-october-2026
- T4https://www.coingabbar.com/en/top-5-ai-crypto-coins-october-2026-market-trends-and-key-data
- T4https://cryptonews.net/news/altcoins/33532853/
- T4https://public.bnbstatic.com/static/files/research/monthly-market-insights-2026-10.pdf
- T4https://x.com/NEARProtocol/status/2107135249943789984
- T4https://x.com/NEARProtocol/status/2107135252372079043
- T3https://coinmarketcap.com/cmc-ai/near-protocol/latest-updates/
- T4https://www.tradingview.com/news/cryptobriefing:f8f617f62094b:0-near-protocol-gains-83-in-four-weeks-leaving-b…
- T4https://usethebitcoin.com/news/near-price-surge-etf-intents-growth/
- T4https://www.cryptotimes.io/2026/10/06/near-price-jumps-128-in-a-month-as-ai-intents-and-hack-recovery-align/
- T4https://www.altcoinbuzz.io/near-rises-137-in-30-days-as-perps-reach-40-of-market-cap
- T3https://coinmarketcap.com/top-stories/6ac9814edd67e817b9118573/
- T4https://blockonomi.com/attacker-returns-funds-after-near-intents-issues-48-hour-recovery-deadline/
- T4https://cryptonews.net/news/security/33531408/
- T4https://coinbureau.com/review/near-protocol
- T4https://www.binance.com/en/square/post/373155350766118
- T3https://defillama.com/protocol/near-intents
- T4https://cryptonews.net/news/analytics/33559067/
- T4https://www.gate.com/en-dubai/blog/near-near-deep-dive-how-near-intents-protocol-revenue-and-ai-agents-are-res…
- T4https://www.tokenpost.com/news/investing/23983
Want a fresh look at NEAR, or another name?
Queue a new deep-research run. Published to the feed when done.
Automated research opinion, published as-is on Oct 11, 2026. Not personalised advice. Figures use end-of-day closes.