Not a trap — but not momentum.
Thesis
Bull case
ROTCE reaches the 17–18% target as buybacks (~$2.5B/qtr) shrink the share count and NII stabilizes at ~$13B/qtr; FY27 EPS of $8.06 holds or rises, and the stock re-rates from ~10x toward 12x forward earnings or ~2x TBV — consistent with analyst targets of $92–$101, i.e. 13–24% upside plus ~2% dividend yield. The pullback has already done the de-rating work; you are buying improving fundamentals at a discounted multiple after the guidance disappointment, not before it.
Bear case
The NII guide has disappointed in tone twice, provisions are rising ($681M → $1.03B YoY), and the rate path is genuinely ambiguous — the evidence bundle contains an unresolved contradiction (one cluster says the Fed cut to 4.00–4.25% with 0–1 more cuts priced; another references 'the Fed's latest rate hike'). If deposit betas stay sticky while asset yields fall, FY27's $8.06 gets cut, and 10x a falling estimate is not cheap. Technically the stock is in a downtrend with elevated vol — 'cheap' has not stopped it from underperforming SPY by 17pp over a year.
What would change our mind
- Q4 2026 NII prints materially below the ~$13B guide AND FY27 NII guidance comes in flat-to-down — confirms the estimate-cut scenario
- FY27 EPS consensus breaks below ~$7.60 (bottom of current range) on net negative revisions — the positive-revision leg of the thesis is dead
- Net charge-offs accelerate above ~0.5% or provisions step up again materially — converts 'contained credit' into a credit thesis
- No ROTCE progress toward 17% by mid-2027 — the re-rating case has no anchor
- Stock breaks below the 52-week low (~$73) on sector-wide credit news — thesis timing is wrong regardless of fundamentals
Since publication vs SPY · closed horizons are frozen
The full research everything the view rests on
Direct answer to the question asked
Where the edge would come from
What the price assumes
At ~$81.68 (~11.1x FY26, ~10.1x FY27 consensus EPS of $7.34/$8.06; ~1.84x TBVPS of $44.46), the price discounts little beyond current run-rate earnings — the market is paying for ~$7.50–8.00 EPS with no premium for the asset-cap/efficiency story. The October re-rating shows investors are pricing NII disappointment and late-cycle credit risk, not ROTCE expansion to 17–18%.
Why the market may be wrong
The market is extrapolating two soft NII quarters while revisions for FY27 EPS are net positive and ROTCE keeps climbing (14.7% → 16.2% 9M YoY). If the 17–18% ROTCE target is reached, a ~16%+ ROTCE bank at ~10x earnings and 1.8x TBV is cheap relative to its own economics — JPM trades at a premium for similar returns. Consensus may be overweighting the unchanged FY26 guide while underweighting buyback-driven EPS accretion (~10% of market cap authorized).
The one thing to watch
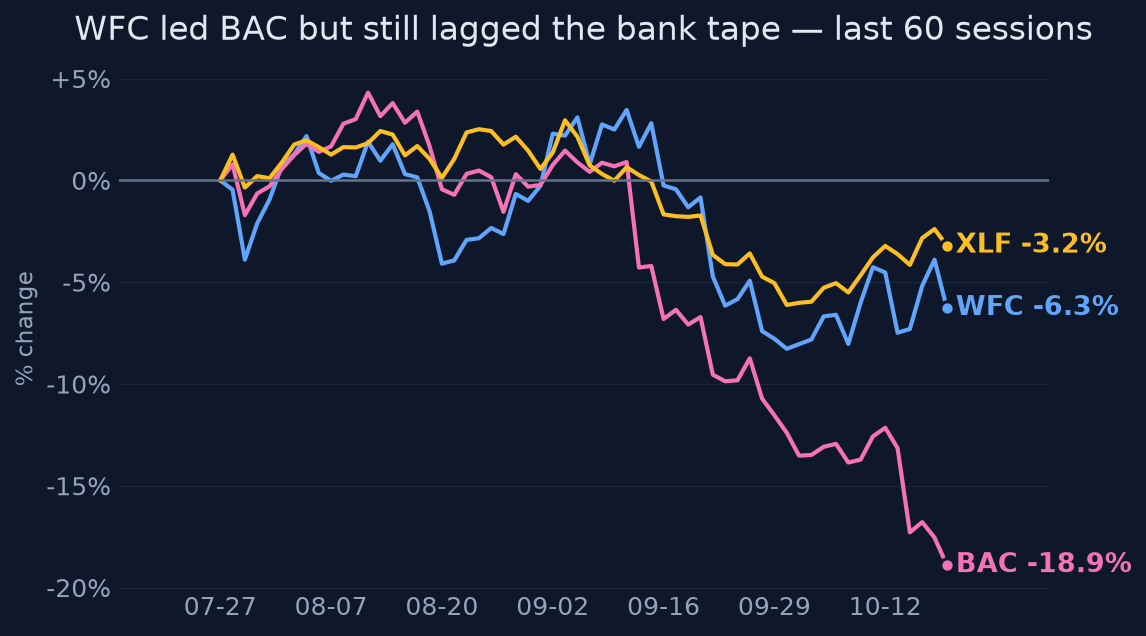
The scan is the trap, not the stock: WFC screens as a leader only on relative-strength-vs-banks (it beat BAC by ~11pp over 3 months) while absolute momentum, trend, and 1y Sharpe (~-0.04) are all negative — so the variable to watch is not price confirmation but the Q4 NII print versus the ~$13B guide, which is the single number that decides whether this is multiple compression or the start of estimate cuts.
Key evidence (9)
- Q3 2026 (reported Oct 13, 2026): EPS $1.87 (+13% YoY) vs ~$1.76–1.86 consensus; revenue ~$21.87B vs ~$22.3B consensus — EPS beat, revenue miss [WFC IR materials; Reuters T2]
- Q3 NII $12.52B, +5% YoY/+2% QoQ but below ~$12.66B consensus; FY26 NII guide held at ~$50B, ~$13B guided for Q4 [Reuters T2]
- ROTCE 16.3% Q3 / 16.2% 9M26 vs 14.7% 9M25; stated target 17–18%; efficiency ratio 63%; TBVPS $44.46 → P/TBV ≈ 1.84x at $81.68 [WFC Q3 2026 earnings supplement]
- FY26 EPS consensus $7.34, FY27 $8.06; revisions net positive over 30 days (FY27: 11 up / 4 down) [consensus aggregation, T4 — directionally consistent but low-tier sourcing]
- Buyback: $2.5B in Q3 2026 (28.6M shares); $40B authorization (Apr 2025), ~$25.7B remaining as of Mar 31, 2026 vs ~$247B market cap [WFC disclosures]
- Price context: -14.2% from 52w high, below 50d SMA ($85.09), 20d vol at 76th percentile, 1y return -1.1% vs SPY +16.0%; outperformed BAC (+10.9pp/3m) but lagged JPM and XLF on all horizons [computed price history]
- Provisions rose to $1.03B (vs $914M QoQ, $681M YoY) though net charge-offs contained at 0.38%; sector-wide selloff (BAC -12.7%/1m, Citi guided Q4 Markets -20%) [Reuters/CNBC T2/T3]
- Post-Q3 analyst actions: target cuts but ratings held — RBC $100→$92 (Outperform), MS $102→$101 (OW), GS $96→$94; CNBC Investing Club upgraded on the pullback [T3/T4]
- Asset cap: Q3 balance-sheet growth is consistent with the cap having been lifted, but NO source in the bundle confirms the formal lift date — treat as unverified assumption [explicit evidence gap]
Catalysts and risks
Catalysts
- Q4 2026 earnings (~mid-January 2027): NII vs the ~$13B guide is the decisive print
- FY2027 NII guidance at Q4 earnings — first clean look at whether the ~$50B base grows
- Any formal confirmation/disclosure on remaining consent orders or asset-cap status (unverified in the evidence)
- Buyback pace disclosure — continuation at ~$2.5B+/quarter supports EPS math
- Fed rate decisions and deposit-cost trajectory through year-end 2026
- Sector read-throughs from JPM/BAC/C Q4 prints on credit and capital markets
Risks
- Scan signal is methodology-dependent and misaligned with actual trend — risk of buying a falling stock on a stale screen
- Rate-path ambiguity: the evidence itself conflicts on whether the Fed is cutting or has hiked — NII sensitivity is unresolved
- Provision creep ($914M → $1.03B QoQ) could foreshadow late-cycle credit normalization, especially commercial (charge-offs ticked to 0.22%)
- Capital-markets normalization hitting fee income (Citi guided Q4 Markets -20%)
- Asset-cap lift date never confirmed in the evidence — part of the growth narrative may rest on an unverified assumption
- Elevated volatility (28% 20d realized, 76th percentile) means even a correct thesis can draw down 15%+ first (1y max drawdown -23%)
What to watch
- Q4 NII vs ~$13B guide and first FY27 NII guidance (Jan 2027)
- 30-day net revision balance for FY27 EPS (currently +7 net)
- Provisions and commercial charge-off rate each quarter
- Quarterly buyback dollars vs the ~$25.7B remaining authorization
- Fed communications resolving the cut-vs-hike contradiction; deposit cost trends in peer prints
- 50d SMA ($85.09) reclaim — would signal the reversal is being confirmed by price, not just value
Market snapshot when the call was made 2026-10-19
Price
| Return 1w | -1.8% |
| Return 1m | -5.0% |
| Return 3m | -6.8% |
| Return 6m | +0.4% |
| Return 1y | -1.1% |
| From 52-week high | -14.2% |
| Realized vol, 20d | 28.3% |
| SPY 3m / 1y | +2.4% / +16.0% |
| QQQ 3m / 1y | +1.3% / +19.7% |
Technicals
WFC technicals as of 2026-10-19: last close $81.80; 20d SMA 81.72 (bearish); 50d SMA 85.09; 12d EMA 82.24; 26d EMA 83.06; RSI 14 54.6 (balanced); 20d vol 24.6%; volume x1.0 vs 20d avg
Verifier notes PASS
Weakly sourced
- 'JPM trades at a premium for similar returns' — the evidence explicitly states peer valuation multiples were not retrievable (only a qualitative framework saying JPM 'usually commands the group's premium'), and no JPM ROTCE figure is in the bundle to support 'similar returns.' Immaterial to the thesis since the valuation case rests on WFC's own multiples, but the comparison should be softened to 'JPM typically trades at a premium.'
Corrections applied
- Soften the JPM comparison in why_market_may_be_wrong to reflect that peer multiples/returns were not verified in the evidence (e.g., 'JPM typically commands a premium valuation'), or drop it.
Sources (28 · T1 = primary filings)
- T2https://www.reuters.com/business/finance/wells-fargo-profit-rises-robust-loan-growth-interest-income-2026-10-1…
- T2http://rmb.reuters.com/rmd/rss/item/tag:reuters.com,2026:newsml_KBN3VT18D?channel=frL012
- T1https://investor.bankofamerica.com/regulatory-and-other-filings/select-sec-filings/content/0000070858-26-00048…
- T1https://investor.bankofamerica.com/regulatory-and-other-filings/select-sec-filings/content/0000070858-26-00048…
- T3https://www.cnbc.com/2026/10/13/bank-earnings-live-updates.html
- T2https://www.reuters.com/business/finance/wall-st-banks-caught-capital-markets-lull-after-strong-first-half-202…
- T2https://www.reuters.com/legal/transactional/major-us-banks-post-solid-third-quarter-loan-growth-see-more-compe…
- T4https://www.wol.com/2026/10/13/bank-earnings-live-updates-html/
- T3https://www.cnbc.com/2026/10/13/bank-earnings-live-updates.html?msockid=2c1fc665be87684e2462d191bf4b6981
- T3https://www.cnbc.com/2026/10/13/bank-earnings-live-updates.html?msockid=134282ef8c8c6358105c95188d026200
- T3https://www.cnbc.com/2026/10/13/bank-earnings-live-updates.html?msockid=19eebd1f55bb6ea634eaaaed54966fd6
- T4https://finance.yahoo.com/markets/stocks/articles/big-bank-third-quarter-earnings-141205059.html
- T4https://finance.yahoo.com/video/jpmorgan-goldman-wells-fargo-citi-kick-off-bank-earnings-what-story-do-they-te…
- T4https://www.forbes.com/sites/mayrarodriguezvalladares/2026/10/13/big-bank-third-quarter-earnings-lenders-stead…
- T4https://www.investors.com/news/jpmorgan-chase-goldman-sachs-earnings-wells-fargo-citigroup/
- T4https://www.wellsfargo.com/assets/pdf/about/investor-relations/earnings/third-quarter-2026-earnings.pdf
- T4https://www.investing.com/news/transcripts/earnings-call-transcript-wells-fargo-tops-q3-2026-eps-forecast-reve…
- T4https://finance.yahoo.com/markets/stocks/articles/wells-fargo-nyse-wfc-misses-105604384.html
- T4https://www.marketbeat.com/earnings/reports/2026-10-13-wells-fargo-company-stock/
- T4https://scanx.trade/stock-market-news/companies/wells-fargo-latest-results-cfo-sees-q4-nii-benefit-higher-rate…
- T4https://finance.yahoo.com/video/what-big-bank-q3-earnings-could-shed-light-on-130633765.html
- T4https://finance.yahoo.com/markets/stocks/articles/big-banks-report-strong-earnings-131500142.html
- T4https://www.wellsfargo.com/assets/pdf/about/investor-relations/earnings/third-quarter-2026-earnings-supplement…
- T4https://www.wellsfargo.com/assets/pdf/about/investor-relations/earnings/third-quarter-2026-financial-results.p…
- T3https://www.cnbc.com/investingclub/2026/10/13/were-upgrading-our-rating-on-wells-fargo-as-the-stocks-pullback-…
- T4https://www.marketscreener.com/news/wells-fargo-mpany-q3-2026-presentation-ce785ddddf88f423
- T4https://finance.yahoo.com/markets/stocks/articles/wells-fargo-co-wfc-q3-230024982.html
- T4https://www.investing.com/news/company-news/wells-fargo-q3-2026-slides-profit-beats-revenue-growth-lags-expans…
Want a fresh look at WFC, or another name?
Queue a new deep-research run. Published to the feed when done.
Automated research opinion, published as-is on Oct 20, 2026. Not personalised advice. Figures use end-of-day closes.