Neither — there's no move.
Thesis
Bull case
The ecosystem moat is intact and the fee base may be turning: Ethereum still clears ~$1.54T/30d of stablecoin settlement, holds ~48% of stablecoin supply, leads RWA tokenization (~$16.8B, >40% share), and its L2s (Base, Arbitrum) keep growing value secured. L1 fees +45% and revenue +120% month-over-month, plus TVL +19.4% over 90 days, could mark the bottom of the post-EIP-4844 fee trough; if mainnet demand (vol-driven DEX flow, RWA issuance, blob fee repricing) compounds, the burn rises toward issuance, the 'inflationary ETH' narrative flips, and at -42% from the 52w high with 0.91 BTC correlation any crypto recovery re-rates ETH quickly. Sentiment votes 87.5% positive and the Oct 13 ETF inflow ($24.8M) show demand can return fast.
Bear case
The token has no working value-capture mechanism at current activity levels: no fee switch, no buybacks; only the burn, which offset ~2.1% of ~797k ETH issued YTD 2026, leaving ~0.5% net inflation against a ~3,900x FDV/revenue multiple. Post-EIP-4844, every marginal unit of ecosystem growth routes to L2s and suppresses L1 fees structurally, while TVL is -41% y/y and reportedly DEX share has collapsed from ~68% to ~20% over a longer horizon [T4, weakly sourced]. ETF holders — the marginal institutional buyer — distributed ~$1B in three weeks with nine consecutive outflow sessions, and the tape confirms distribution: below the 20d/50d SMAs, bottom of the 20d range, -8% relative strength vs BTC in a month. If BTC itself rolls over, ETH's 1.06 beta amplifies the decline with no fundamental floor underneath.
What would change our mind
- For the no-edge read turning bearish: 30d L1 fees fall back below ~$12M while ETF outflows continue past ~$1.5B cumulative and price loses the 200d SMA (-11.7% below current)
- For the no-edge read turning bullish: 30d fees sustain >$50M for two consecutive months, the burn/issuance offset exceeds ~10%, and weekly ETF flows print three consecutive positive weeks
- The 'BTC beta only' framing is invalidated if the ETH/BTC ratio breaks out of its year-long downtrend on idiosyncratic strength (correlation-driven relative strength +5% or more over a month with no BTC move)
- The 'no thin-liquidity issue' conclusion is invalidated if volume/mcap falls below ~2% while daily ranges expand — not currently the case
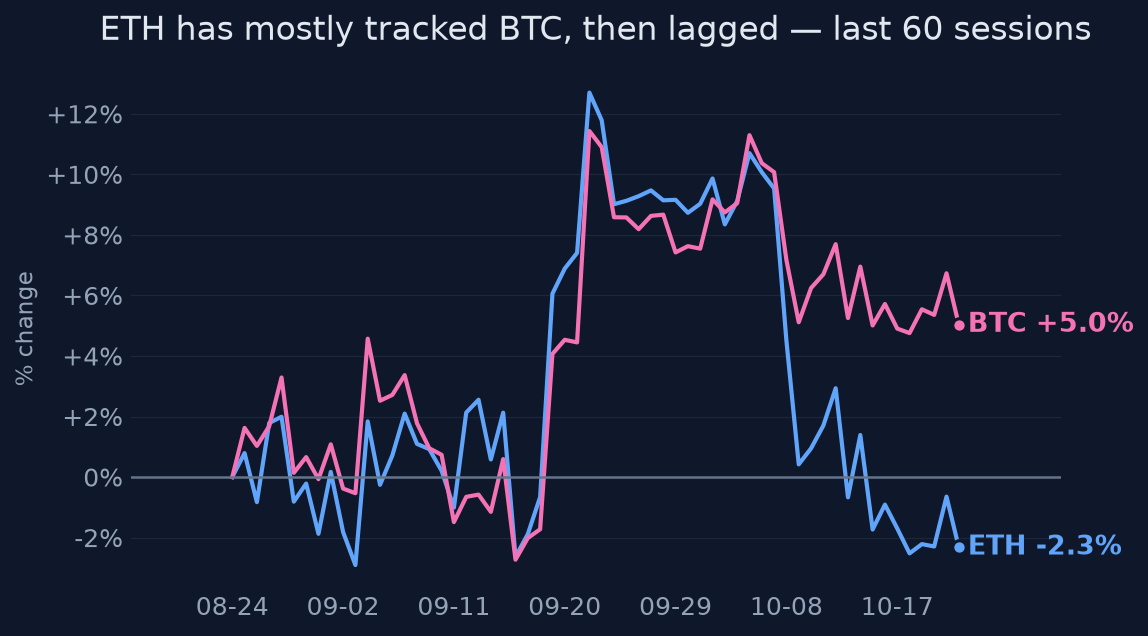
Since publication vs BTC · closed horizons are frozen
The full research everything the view rests on
Direct answer to the question asked
Where the edge would come from
What the price assumes
At $2,405 (mcap ~$294B), the market is pricing ETH as a high-beta BTC proxy with a modest ecosystem premium, but with little credit for fee-based value accrual: FDV/annualized L1 revenue is ~3,900x and annualized fees are 0.07% of market cap, so the price cannot be 'supported' by cash-flow-like fundamentals in any conventional sense. The -42% drawdown from the 52w high and -37.8% 1y return vs BTC's -24.6% show the market has already been de-rating ETH relative to BTC for a year; October's ~$1B ETF outflows (mostly ETHA) suggest institutions are still reducing, not accumulating.
Why the market may be wrong
Both directions are falsifiable. Bearish consensus could be wrong if the fee/revenue upturn (30d fees +45%, revenue +120% vs prior period) is the start of a genuine mainnet demand cycle rather than a base effect — if 30d fees compound to >$50M/30d for two consecutive months while stablecoin settlement (~$1.54T/30d) keeps growing, the 'activity doesn't pay the L1' thesis weakens and the burn could re-approach issuance. Bullish consensus (if the scan reflects one) could be wrong because the ecosystem-vs-token gap is structural: L2 growth, RWA, and stablecoin settlement can all thrive while L1 fees stay near zero, leaving ETH with ~0.5% net annual inflation, no fee switch, and ETF flow headwinds.
The one thing to watch
Stop watching ETH price against activity dashboards and watch the single ratio that decides the thesis: L1 fee burn vs validator issuance. In 2026 that offset was ~2.1% (797k ETH issued vs 16.5k burned through Oct 9), meaning 'ultrasound money' is currently ~0.5% net inflation; the entire bull case on value accrual reduces to whether mainnet gas demand can push that offset back toward 100%, and October's +45% fee uptick — off a ~$17M/30d base — is the first, still-tiny, falsifiable test of that.
Key evidence (11)
- Price $2,405.09 as of 2026-10-22; -13.3% 1m, +24.4% 3m, -37.8% 1y; -42.2% below 52w high (CoinGecko market data)
- Realized vol 20d = 37.4% annualized vs 60.9% 1y; vol at 19th percentile of own year; 1m return z-score -0.69; price at bottom 1% of 20d range (computed from daily price history)
- BTC beta: 60d correlation 0.91, beta 1.06, idiosyncratic variance share 17%; BTC +23.5% over same 3m window ETH was +24.4%; ETH -7.6% vs BTC over 1m, -13.2% over 1y (quant decomposition, 400 overlapping days)
- 24h volume $12.82B = 4.4% of market cap — deep, normal liquidity; no thin-liquidity signature (CoinGecko snapshot, 2026-10-22)
- L1 fees $2.20M/7d, $17.4M/30d, $355k/24h; revenue $6.2M/30d; fees +44.6% and revenue +119.6% 30d vs prior 30d — low-base effect (DefiLlama, 2026-10-22)
- TVL $49.6B, -8.8% 30d, +19.4% 90d, -41.4% 1y; mcap/TVL 5.93x; FDV/annualized revenue ~3,888x (DefiLlama, 2026-10-22)
- Net inflationary 2026: ~796,623 ETH gross issuance Jan 1–Oct 9 2026 vs ~16,525 ETH burned (~2.1% offset) — per TokenPost calculation [T4, single source; direction consistent with DefiLlama fee levels]
- US spot ETH ETF net outflows ≥ ~$991.7M Oct 5–20, 2026, ~82–93% from BlackRock ETHA; BTC ETFs also outflowed ~$228M in the Oct 12–16 week — broad de-risking amplified by ETHA scale [T4 aggregation of Farside data; direction well-corroborated, exact figures not]
- Real activity: ~$1.54T stablecoin transfer volume/30d on Ethereum (through Oct 16); ~$146B stablecoin supply (~47.6% share); DEX spot +13% QoQ to ~$571B; RWA >40% share, ~$16.8B hosted; Base ~$15.6B and Arbitrum ~$10.6B value secured [T2 The Block for RWA; T4 for the rest]
- No verified upgrades, governance votes, unlocks, or regulatory catalysts found for the Oct 22, 2026–Jan 20, 2027 window (research search, no primary sources)
- Unconfirmed lead: Galaxy Research [T3] referenced ~20% Ethereum Foundation layoffs in 2026 — material to ecosystem development capacity if true, not independently verified here
Catalysts and risks
Catalysts
- Two consecutive months of 30d L1 fees >$50M would signal a genuine fee-regime turn rather than base effect (DefiLlama-trackable)
- Weekly ETF flow reversal: a sustained run of positive weekly net inflows after ~$1B of October outflows (Farside data)
- Burn/issuance offset rising materially above ~2% toward double digits (ultrasound.money / Token Terminal)
- Any announced Ethereum upgrade schedule for Q4 2026–Q1 2027 (none verified as of Oct 22)
- BTC direction: with 0.91 correlation and 1.06 beta, a BTC breakout or breakdown is the dominant ETH 'catalyst'
- Confirmation or denial of reported Ethereum Foundation layoffs (~20% workforce) [Galaxy, T3, unconfirmed]
Risks
- Structural: L2 migration and EIP-4844 blob pricing keep L1 fees near zero regardless of ecosystem growth — activity is not a catalyst for the token
- Flow risk: ETHA-led redemptions have been persistent (nine consecutive sessions); further ETF de-risking hits price directly
- Supply: ~0.5% net annual inflation with no cap and no offset while activity stays off-L1
- Beta risk: 1.06 beta to BTC means ETH falls harder in a crypto drawdown; QQQ correlation is ~0, so no equity-rally hedge
- Data risk: precise ETF flow figures and the burn/issuance tally rest on T4 aggregations; direction is corroborated but magnitudes could be revised
- Governance/organizational: unconfirmed EF layoffs could slow protocol development if true
What to watch
- DefiLlama Ethereum chain fees 30d rolling: is +45% compounding or mean-reverting?
- Farside weekly ETF flow table, specifically ETHA vs the rest of the complex
- Burn vs issuance offset (YTD ~2.1% as of Oct 9, 2026)
- ETH/BTC ratio and 60d correlation — whether ETH can decouple from pure beta
- Stablecoin supply on Ethereum (~$146B) — growth or migration to other chains
- Ethereum TVL trend after -8.8% over 30d; watch whether the +19% 90d trend resumes
- Any verified Q4 2026/Q1 2027 upgrade announcement from ethereum.org or client teams
Market snapshot when the call was made 2026-10-22
Price
| Return 1w | -0.6% |
| Return 1m | -13.3% |
| Return 3m | +24.4% |
| Return 6m | +1.2% |
| Return 1y | -37.8% |
| From 52-week high | -42.2% |
| Realized vol, 20d | 37.4% |
| BTC 3m / 1y | +23.5% / -24.6% |
| QQQ 3m / 1y | +4.8% / +18.6% |
Technicals
Sources (16 · T1 = primary filings)
- T4https://www.coininsider.org/news/ether-etfs-extend-outflows-as-bitcoin-funds-edge-positive/
- T4https://coindoo.com/ethereum-etfs-gave-back-a-quarter-of-q3s-inflows/
- T4https://crypto.news/ethereum-etf-outflows-bitcoin-etfs-october-2026/
- T4https://coinpaper.com/37188/bitcoin-and-ethereum-etf-outflows-deepen-as-uptober-rally-faces-fresh-pressure
- T4https://www.bitget.com/amp/news/detail/12560605944478
- T4https://primexbt.com/news/ether-etfs-lose-320-1-million-overtaking-bitcoin-funds-in-weekly-outflows/
- T4https://blockchainreporter.net/ethereum-etf-outflows-top-bitcoin-by-92-million-october-2026/
- T4https://coinpaper.com/37439/ethereum-price-prediction-blackrock-records-2595-million-in-three-day-etf-withdraw…
- T2https://www.theblock.co/newsletters/data-and-insights/2026-10-20-data-rwa-chains-more-diverse-opensea-returns-…
- T4https://www.tokenpost.com/news/investing/37625
- T4https://www.cryptopolitan.com/arks-defi-recovery-ethereum-mainnet-slips/
- T4https://sqmagazine.co.uk/ethereum-statistics/
- T4https://castlelabs.io/research/crypto-revenue-rankings
- T4https://www.ainvest.com/news/eth-etf-inflows-persist-staking-shock-l2-exit-cloud-outlook-october-4-2026-2610/
- T4https://hinkal.io/blog/multi-chain-blockchain-statistics
- T3https://www.galaxy.com/insights/research/ethereum-foundation-layoffs-20-percent-workforce-third-iteration-2026
Want a fresh look at ETH, or another name?
Queue a new deep-research run. Published to the feed when done.
Automated research opinion, published as-is on Oct 22, 2026. Not personalised advice. Figures use end-of-day closes.