Normalization, partially de-risked already.
Thesis
Bull case
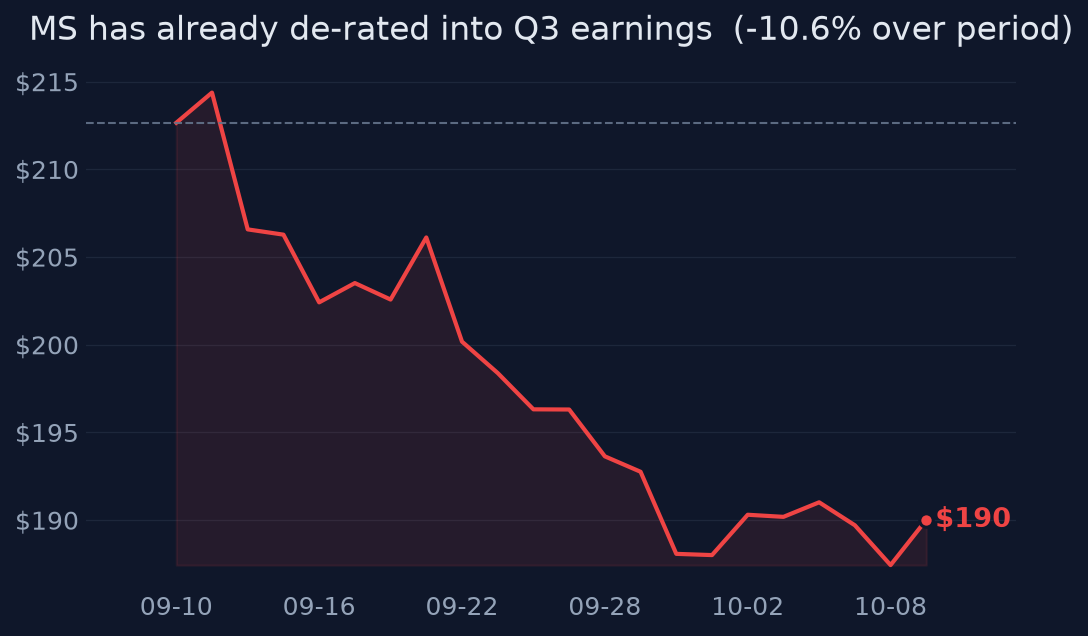
The selloff pre-de-risked the print: consensus already cut ~15% sequentially, analysts cut targets on valuation rather than fundamentals, and the stock is technically oversold (RSI ~21) with no adverse disclosure. If Q3 lands at or above ~$3 EPS with equities trading near $4.9B, IB flat-to-up (JPM's mid-to-high-teens IB read-through), and NNA >$100B, the market learns Q2's 26.6% ROTCE run-rate is durable, the $10T wealth-asset ambition stays credible, and the stock re-rates back toward the $207–223 analyst target band (+10–17%).
Bear case
Q2 was the cyclical peak: BofA's IB warning and Goldman's 'muted' characterization fit a Q3 where underwriting cooled, and consensus ~$2.92 may still embed too much trading strength. The target cuts could be the first leg of estimate cuts — Zacks already showed a 4.7% EPS cut in one week. With 48% idiosyncratic variance vs SPY and a 1.2 beta, a genuine miss (IB <$2B, NNA <$50B, WM margin compression) on a stock still +25% YoY could extend the drawdown toward the 52-week-low region (~$148), i.e., -20%+.
What would change our mind
- Bullish relief thesis invalidated if Q3 NNA falls below ~$50B or WM pre-tax margin drops materially below ~27%
- Bearish 'peak earnings' thesis invalidated if Q3 EPS ≥ ~$3.10 with IB ≥ $2.3B and NNA ≥ $100B
- Valuation-reset framing invalidated if any disclosed regulatory/credit event emerges that explains the 1.6-sigma move
- If FY27 consensus EPS is cut >5% in the weeks after the print, the downgrade cycle is fundamental, not valuation-only
Since publication vs SPY · closed horizons are frozen
The full research everything the view rests on
Direct answer to the question asked
Where the edge would come from
What the price assumes
Consensus is roughly $2.83–$3.10 EPS (clustering near $2.92–$2.94) and $19.6–$20.5B revenue — i.e., ~10% YoY revenue growth but only ~3–4% EPS growth, and a deliberate ~15% sequential EPS haircut from Q2's $3.46. The market is explicitly not paying for another Q2; it is testing how much of Q2 was repeatable. Equities trading (~$4.5–4.9B) and IB (~$2.2–2.3B, flat-to-slightly-up YoY) are the key embedded assumptions.
Why the market may be wrong
Two-sided. Upside: the 1.6-sigma selloff may have over-corrected for a 'peak Q2' narrative that the revision data doesn't actually support — revisions were mixed, not a broad reset, and JPMorgan guided IB fees up mid-to-high teens while peer trading commentary stayed constructive. Downside: BofA warned IB fees could fall 10%+ YoY and Goldman called the quarter muted; if MS's equities/IB came in at the cautious end, consensus ~$2.92 could still be too high despite the selloff.
The one thing to watch
The variable to watch is not the headline EPS beat/miss — it is whether Wealth Management net new assets hold anywhere near Q2's $148B pace, because MS trades as a GS proxy (0.91 correlation) only when the market treats it as a markets stock; sustained NNA above ~$100B with a ~30% WM margin is what justifies a structural re-rating toward a fee-driven multiple, while a flow collapse reverts it to a pure capital-markets cyclical right when the group is de-rating.
Key evidence (9)
- Q3 2026 report confirmed for Oct 14, 2026 ~7:30am ET, call 9:30am ET (Morgan Stanley IR) [T1/T4-verified via IR]
- Consensus cluster ~$2.92–$2.94 EPS, revenue ~$19.6–$20.5B; aggregators inconsistent ($2.83 Zacks to $3.10) [T3/T4 — flagged as not fully auditable]
- Q2 2026 actuals: record $21.3B revenue vs $19.62B consensus; $3.46 EPS vs $2.93; ISG $11.0B; WM $8.9B with 30.5% pre-tax margin and $148B NNA; ROTCE 26.6%; CET1 14.8%; $1.5B buybacks (Q2 release/SEC) [T1]
- Q3 2025 base: ~$2.80 EPS, $18.22B revenue — consensus implies ~10% revenue growth but only ~3–4% EPS growth YoY
- Price action: -10.65% 1m, -13.58% 3m, +24.85% 1y; -13.4pp vs SPY and -6.9pp vs XLF over 1m; RSI 20.7; 1.64-sigma 1m move [market data]
- Pullback drivers were valuation actions, not news: TD Cowen Hold/$210, Erste downgrade, target cuts to $207–$223 from BMO, Evercore, Citi, Wells Fargo, Goldman [T3/T4]
- Peer read-throughs mixed: JPM IB fees guided mid-to-high teens up; BofA warned IB fees down 10%+; Goldman described Q3 as muted [T2/T3]
- Management Q2 guidance: modestly higher sequential NII in Q3; full-year tax rate 22–23% [T1 transcript coverage]
- MS-GS 60d correlation 0.91 — MS largely trades as a GS proxy [quant analysis]
Catalysts and risks
Catalysts
- Q3 2026 earnings Oct 14, 2026 7:30am ET — the immediate binary event
- Segment disclosure: equities trading (~$4.5–4.9B expected), IB (~$2.2–2.3B expected), WM NNA and pre-tax margin vs Q2's $148B/30.5%
- Management commentary on Q4 IB pipeline, NII trajectory, and the $10T wealth-asset goal
- Capital-return updates (buyback pace vs $1.5B in Q2; CET1 14.8% leaves room)
- Peer prints (GS, JPM, SCHW) in the same week setting the capital-markets narrative
Risks
- Binary event risk: earnings are 2 days away; no time to build a position on this analysis
- Consensus data inconsistency ($2.83–$3.10) makes the actual 'whisper' bar uncertain
- Trading/IB revenue is inherently low-visibility; Q2's record ISG may be unrepeatable
- High GS correlation (0.91) means MS gets dragged by sector de-rating regardless of its own print
- If the selloff was actually informed (not just valuation caution), a miss would compound
- Rate-path sensitivity of NII and wealth flows
What to watch
- Oct 14 print vs the $2.92–$2.94 cluster, not the low $2.83 outlier
- Wealth NNA: >$100B durable; $50–100B normalization; <$50B thesis-breaking
- Equities trading vs ~$4.5–4.9B expectation and IB vs ~$2.2B
- WM pre-tax margin vs 30.5% and fee-based asset growth
- Post-print revisions: do analysts lift FY27 back toward pre-selloff levels?
- Whether MS breaks or holds its 0.91 GS correlation after results
Market snapshot when the call was made 2026-10-09
Price
| Return 1w | -0.1% |
| Return 1m | -10.7% |
| Return 3m | -13.6% |
| Return 6m | +8.1% |
| Return 1y | +24.9% |
| From 52-week high | -16.4% |
| Realized vol, 20d | 22.3% |
| SPY 3m / 1y | +3.9% / +15.7% |
| QQQ 3m / 1y | +5.5% / +22.9% |
Technicals
MS technicals as of 2026-10-09: last close $190.02; 20d SMA 195.99 (bearish); 50d SMA 207.33; 12d EMA 192.25; 26d EMA 198.07; RSI 14 20.7 (oversold); 20d vol 19.0%; volume x0.8 vs 20d avg
Next earnings: 2027-01-14 BMO
Sources (35 · T1 = primary filings)
- T1https://www.sec.gov/Archives/edgar/data/895421/000089542126000207/a2q26msearningsrelease.htm
- T1https://www.sec.gov/Archives/edgar/data/895421/000089542126000111/a1q26msearningsrelease.htm
- T4https://www.morganstanley.com/content/dam/msdotcom/en/about-us-ir/shareholder/1q2026.pdf
- T4https://www.morganstanley.com/about-us-ir/shareholder/2q2026.pdf
- T4https://stockanalysis.com/stocks/ms/transcripts/649665-q2-2026/
- T4https://finance.yahoo.com/quote/DWD.SG/earnings/DWD.SG-Q2-2026-earnings_call-649665.html
- T4https://www.morganstanley.com/about-us-ir?icid=etrade_globalfooterlogin_investorrelations
- T4https://www.investing.com/news/transcripts/earnings-call-transcript-morgan-stanley-posts-record-q2-2026-result…
- T4https://scanx.trade/stock-market-news/companies/morgan-stanley-q3fy26-results-analysts-forecast-3-10-eps-20-52…
- T4https://www.marketbeat.com/stocks/NYSE/MS/earnings/
- T4https://finance.yahoo.com/quote/MS/analysis/
- T4https://www.marketbeat.com/instant-alerts/upcoming-morgan-stanley-ms-projected-to-release-quarterly-earnings-o…
- T4https://finance.yahoo.com/markets/stocks/articles/analyst-projections-key-metrics-reveal-121503737.html
- T4https://www.galvnews.com/news_reuters/business/us-bank-investors-to-focus-on-impact-of-higher-rates-deals-outl…
- T4https://www.marketbeat.com/earnings/reports/2026-10-14-morgan-stanley-stock/
- T4https://polymarket.com/event/ms-quarterly-earnings-gaap-eps-10-14-2026-3pt17
- T4https://www.einpresswire.com/article/948851099/beinsure-forecast-wall-street-s-biggest-banks-face-rising-rates…
- T4https://tickeron.com/blogs/morgan-stanley-ms-q3-2026-earnings-preview-steady-growth-expected-despite-trading-n…
- T4https://finance.yahoo.com/markets/stocks/articles/morgan-stanley-lagged-peers-ubs-094447004.html
- T4https://www.zacks.com/stock/news/3003599/what-analyst-projections-for-key-metrics-reveal-about-morgan-stanley-…
- T4https://www.mexc.com/en-GB/crypto-pulse/article/us-bank-earnings-preview-167819
- T4https://finance.yahoo.com/markets/stocks/articles/morgan-stanley-stock-ahead-q3-141700757.html
- T4https://www.morganstanley.com/about-us-ir
- T4https://www.morganstanley.com/about-us-ir/earnings-releases
- T4https://simplywall.st/stocks/us/diversified-financials/nyse-ms/morgan-stanley
- T4https://finance.yahoo.com/markets/stocks/articles/morgan-stanley-direct-lending-fund-201500032.html
- T1https://www.sec.gov/Archives/edgar/data/895421/000089542126000212/exhibit15q22026_10-q.htm
- T4https://www.morganstanley.com/content/dam/msdotcom/en/about-us-ir/shareholder/2q2026.pdf
- T1https://www.sec.gov/Archives/edgar/data/895421/000089542126000212/exhibit322q22026_10-q.htm
- T1https://www.sec.gov/Archives/edgar/data/1782524/000119312526337915/0001193125-26-337915-index.html
- T1https://www.sec.gov/Archives/edgar/data/895421/000089542126000212/0000895421-26-000212-index.htm
- T4https://www.morganstanley.com/about-us-newsroom
- T4https://www.morganstanley.com/about-us-ir/morgan-stanley-third-quarter-2026-investor-conference-call
- T4https://finance.yahoo.com/quote/MS/profile/
- T4https://quartr.com/companies/morgan-stanley_3903
Want a fresh look at MS, or another name?
Queue a new deep-research run. Published to the feed when done.
Automated research opinion, published as-is on Oct 12, 2026. Not personalised advice. Figures use end-of-day closes.