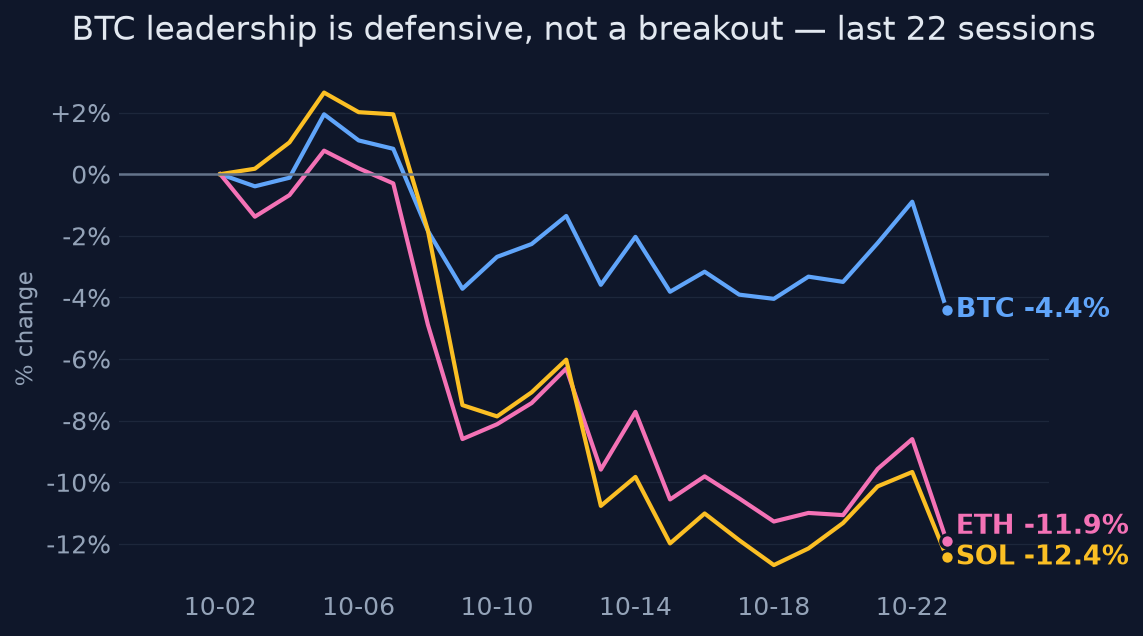
Real activity, but defensive.
Thesis
Bull case
The Oct 19-21 inflows show institutional demand can reappear in size at $80k; with 95.7% of supply issued, 0.8% annualized inflation, and the 2028 halving approaching, even modest sustained ETF absorption squeezes a thin float. Rising dominance during an altcoin bleed is classically how new BTC-led cycles begin, and price holding 11% above the 200d while alts collapse shows genuine relative bid.
Bear case
Net October ETF flows are negative after the largest single-day outflow since June, on-chain usage is stagnant-to-declining (fees trivial at $7.2M/month, TVL -45% y/y), and there is no macro or regulatory catalyst. BTC has no cash-flow value-accrual (no burns, buybacks, staking — fees go to miners), so at $81k the price still embeds substantial monetary-premium recovery 35% below ATH; a resumption of the outflow streak breaks the 200d and reopens the drawdown.
What would change our mind
- Sustained net ETF inflows >$2B/week for 2+ weeks with BTC reclaiming the 50d SMA → bearish/neutral stance invalid, shift bullish
- Break below the 200d SMA (~$72.8k) on continued ETF outflows → confirms distribution, shift bearish
- Stablecoin supply contraction + falling exchange volumes → liquidity-based invalidation of the recovery
- On-chain fees and TVL turning decisively positive (e.g., 30d fees +50% m/m) → would upgrade 'no fundamental demand' assessment
Since publication vs BTC · closed horizons are frozen
The full research everything the view rests on
Direct answer to the question asked
Where the edge would come from
What the price assumes
At $81k with a 1y Sharpe of -0.64 and price 29% below the 52w high, the market is pricing cautious recovery after the -48.8% drawdown — not a new bull leg. Positioning appears balanced-to-defensive: October cumulative ETF flows are roughly flat-to-negative, and vol at the 24th percentile implies no crash or breakout is being priced.
Why the market may be wrong
If the Oct 19-21 inflow surge (+$1.075B, largest since September) marks the start of sustained institutional re-accumulation rather than one-off positioning, the market is underpricing a supply-absorption setup with 95.7% of max supply already issued. Conversely, if Oct 22's -$635M outflow (largest since June 25) is the start of a renewed redemption streak, the quiet tape is masking distribution at 11% above the 200d SMA.
The one thing to watch
The variable to watch is not BTC price but the divergence between rising BTC dominance and negative absolute ETF flows: BTC is currently the crypto-internal safe haven, so its next directional break will likely be decided by whether the marginal dollar enters crypto at all (ETF flows) rather than by anything BTC-specific — watch the 2-3 daily flow prints after Oct 22's record-class outflow.
Key evidence (9)
- Price -1.3% 1w / -5.9% 1m / +24.7% 3m; still -35.5% below Oct 2025 ATH of $126,080 (CoinGecko, 2026-10-23)
- Realized vol 29.9% ann., 24th percentile of trailing year; 1m return z-score -0.37 — one of the quietest tapes of the year
- 24h volume $24.4B = 1.5% of $1.64T market cap — deep liquidity, not thin
- US spot ETF flows: +$1.075B Oct 19-21 (IBIT +$665M Oct 19 alone), then -$635.5M Oct 22, largest one-day outflow since June 25; October cumulative net negative (Farside-derived, T4 sources only)
- On-chain fundamentals flat: 30d fees $7.2M (+5.9% m/m); Bitcoin DeFi TVL $4.36B, -5.0% 30d, -44.9% 1y (DefiLlama, T3)
- Relative strength flip: BTC +8.7% vs ETH and +7.6% vs SOL over 1m after lagging over 3m; ETH -13.4% 1m, SOL -12.5% 1m
- 60d correlation to QQQ ~0 (beta -0.05) vs 0.91 to ETH — price discovery is crypto-native, not equity beta
- Technicals: below 20d and 50d SMAs, +11.4% above 200d — recovery within a broader downtrend
- No verified catalyst: no regulatory event, protocol upgrade, or macro decision identified in the window; bounce attributed to general risk appetite (T4 coverage)
Catalysts and risks
Catalysts
- Next 3-5 daily US spot ETF flow prints — whether Oct 22's -$635M was one-off or a new streak
- Fed policy path and dollar/liquidity conditions over the next two FOMC meetings (attribution currently unverified)
- Any confirmed US regulatory/market-structure development for crypto in Q4 2026
- April 2028 halving narrative build-up (longer-dated)
- ETH/SOL stabilization or capitulation — resolves whether dominance rotation continues
Risks
- ETF flow whipsaw: positioning is fickle, and T4-only flow data carries revision risk (±10%)
- The macro attribution is speculative — if the recovery rested on unverified easing expectations, a hawkish surprise unwinds it
- No fundamental floor: fees/market cap 0.01% annualized means price is pure monetary premium
- Correlation regime risk: correlation to QQQ is ~0 now but historically re-couples during risk-off episodes
- Dominance rotation can reverse violently if alt sentiment recovers, removing the relative-strength thesis
What to watch
- Daily Farside/Farside-derived US spot ETF flow prints through end of October
- BTC dominance index vs ETH/SOL relative strength (does the +8-9% monthly flip extend?)
- Price behavior around the 200d SMA (~$72.8k) and 50d SMA (~$81.8k)
- Stablecoin total supply and exchange reserve trends (unverified this cycle — fill the gap)
- Realized vol: a break out of the 24th percentile in either direction signals regime change
- Fed communications and DXY for macro attribution
Market snapshot when the call was made 2026-10-23
Price
| Return 1w | -1.3% |
| Return 1m | -5.9% |
| Return 3m | +24.7% |
| Return 6m | +3.6% |
| Return 1y | -24.6% |
| From 52-week high | -29.1% |
| Realized vol, 20d | 29.9% |
| ETH 3m / 1y | +26.9% / -37.4% |
| QQQ 3m / 1y | +3.0% / +15.2% |
Technicals
Sources (15 · T1 = primary filings)
- T4https://x.com/FarsideUK/status/2113114830022263289
- T4https://econotimes.com/Bitcoin-BTC-ETFs-Net-1-07-Billion-Ether-ETH-Funds-Lose-114-5-Million-1760571
- T4https://x.com/FarsideUK/status/2112389898909135293
- T4https://cointelegraph.com/markets/bitcoin-etfs-527m-inflows-biggest-since-september
- T4https://bitcoinalmanack.com/etfs/bitcoin-etf-flow-tracker/
- T4https://x.com/FarsideUK/status/2108766396767211658
- T4https://x.com/FarsideUK/status/2112752147947516265
- T4https://x.com/FarsideUK/status/2108046265413988766/photo/1
- T4https://finance.yahoo.com/markets/crypto/articles/bitcoin-etf-holders-pull-635-052529730.html
- T4https://www.tokenpost.com/news/investing/38712
- T4https://econotimes.com/U-S-Bitcoin-ETFs-Draw-526-7-Million-as-Spot-Sellers-Persist-1757689
- T4https://www.cryptopolitan.com/bitcoin-etfs-october-red-635m-outflow/
- T4https://www.tradingkey.com/news/cryptocurrencies/262235700-cryptopolitan
- T4https://sourcedblock.com/briefing/
- T4https://btc-pulse.com/bitcoin/bitcoin-etf-news-today-flows-sec-moves-and-filings/
Want a fresh look at BTC, or another name?
Queue a new deep-research run. Published to the feed when done.
Automated research opinion, published as-is on Oct 23, 2026. Not personalised advice. Figures use end-of-day closes.