Good story, high bar — lean bullish.
Thesis
Bull case
FY27 guidance was 6–9% above consensus, so estimate revisions grind upward for two quarters regardless of sentiment. AI orders accelerated to a $4B quarterly exit rate with hyperscaler, neocloud, sovereign, and enterprise streams broadening; Ethernet is gaining share vs InfiniBand in AI back-ends and Cisco is the cheapest large-cap way to own that at ~22x vs ANET's ~47x (T4-sourced, approximate — but the directional valuation gap is consistent across sources). Margin compression is guided, quantified (65–66%), and mix-driven — if memory costs ease or software/security (double-digit order growth) outgrows hardware, margins inflect back and the stock re-rates toward $130+ (25x ~$5.20 revised EPS). Buybacks and dividend provide a floor; the sell-off already flushed weak hands at 2.7x volume.
Bear case
The market just told you a beat-and-raise wasn't enough — expectations are the problem, not the quarter. AI orders are orders, not revenue: FY26 intake of $9.3B against a $7.5B FY27 AI revenue target means order flow must stay elevated just to tread water, and Q4's $4B could be a single lumpy hyperscaler commitment. Every incremental AI dollar arrives at lower gross margin, so EPS leverage permanently lags revenue leverage; services is flat, security/Splunk contribution is unquantified, and the core campus refresh is cyclical. On multiple risk: at ~22x forward, a derating to 18x on $5.08 EPS implies ~$91 (-20%) and to 16x implies ~$81 (-27%) — this assumes the pre-AI multiple norm was meaningfully below 22x, which is plausible given Cisco's multi-decade history as a mature grower but is an assumption, not a sourced historical range from this evidence bundle. Any order deceleration at the Nov print triggers that compression with no estimate miss required.
What would change our mind
- FY27 Q1 AI infrastructure orders below ~$2B (Nov 10, 2026 print)
- Q2 FY27 gross margin guided below 65% or management attributes further compression to pricing rather than mix
- FY27 revenue guidance cut or held while AI orders decelerate — would signal Q4's $4B was pull-forward
- Stock breaks decisively below ~$100 (roughly 19–20x guided EPS) on rising volume, indicating the revision tailwind is being rejected
- Hyperscaler capex guides for CY2027 flatten or decline
Since publication vs SPY · closed horizons are frozen
The full research everything the view rests on
Direct answer to the question asked
Where the edge would come from
What the price assumes
At $113.47 (~22x FY27 guided EPS of ~$5.08, market cap ~$447B), the price already embeds: (1) FY27 guidance being hit or beaten — consensus will mechanically revise up ~6–9%; (2) the AI order supercycle continuing at multi-billion-dollar quarterly run-rates; (3) gross margin stabilizing near 65–66% rather than sliding further. The 6% drop on a beat-and-raise tells you expectations going in were even higher than the above-consensus guide, and the market is now skeptical that AI revenue dollars carry the same margin quality as legacy networking dollars. The relative-value anchor — CSCO ~22x vs ANET ~47x — rests on T4 sources and should be treated as approximate, though the directional gap (Cisco far cheaper than Arista) is robust across those sources.
Why the market may be wrong
Two-sided. Bears may be wrong because: the margin compression is mix-driven and explicitly guided (not a demand or pricing shock), orders of $9.3B with a $4B exit quarter suggest backlog coverage into FY27, and the relative multiple gap vs ANET is wide even allowing for the T4-sourced imprecision of the exact figures. Bulls may be wrong because: FY26 AI orders ($9.3B) exceed the FY27 hyperscaler AI revenue target (~$7.5B), meaning order flow must keep accelerating just to sustain the revenue line — the $4B Q4 could be one lumpy hyperscaler commitment rather than a new run-rate; and services revenue was flat, so the non-AI core is not inflecting.
The one thing to watch
Stop watching headline AI orders; start watching margin-per-AI-dollar and the orders-to-revenue bridge. FY26 AI orders were $9.3B but the FY27 hyperscaler AI revenue target is only ~$7.5B — so Cisco needs roughly $2B+ of new AI orders every quarter through FY27 merely to keep the revenue flywheel turning, and each of those dollars arrives at a lower gross margin than the campus/software revenue it displaces in the mix. The falsifiable tell: if the Nov 10 print shows AI orders <$2B with gross margin still guided at/below 66%, this is a one-time capex burst at dilutive economics, not a supercycle.
Key evidence (12)
- FY26 Q4 results (Aug 12, 2026, Cisco IR [T1]): revenue $17.25B vs ~$16.8B consensus; adj EPS $1.22 vs ~$1.17–1.19 consensus
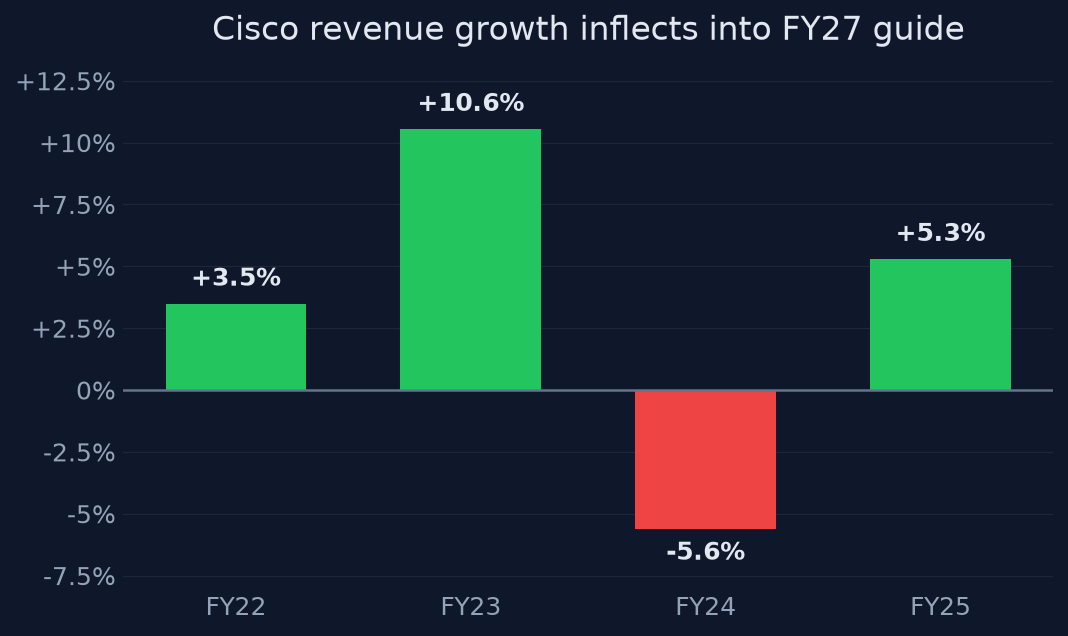
- FY27 guidance (Aug 12, 2026 [T1/T4]): revenue $72.2–73.4B vs ~$68.7B LSEG consensus; adj EPS $5.05–5.11 vs ~$4.64–4.80 consensus — implies ~14–16% revenue and ~18% EPS growth vs FY26 ($63.8B / $4.31)
- Q1 FY27 guide: revenue $18.0–18.2B, EPS $1.32–1.34, both above consensus; non-GAAP gross margin guided 65–66% vs 66.3% in Q4 (CNBC [T3], IR [T1])
- AI infrastructure orders: Q1 $1.3B, Q2 $2.1B, Q3 $1.9B, Q4 $4.0B = $9.3B FY26 (Cisco IR releases/slides [T1]); up ~4.5x YoY per earnings slides coverage [T4]
- FY27 target: ~$7.5B AI infrastructure revenue from hyperscalers [T1/T4]; enterprise/sovereign/neocloud is a smaller second stream (~$200M+ in Q1)
- Margin pressure attributed to higher hardware/AI mix and elevated memory costs, not tariffs [T4 synthesis; no primary transcript quote obtained]
- Services revenue flat YoY in Q4; security orders grew double digits [T4, not confirmed against primary segment table]
- Price action: -6.13% 1w post-print on 2.7x average volume; -12.7% below 52w high after +58.97% 1y; realized vol 42.5% annualized
- 1y relative performance (computed from price history): CSCO +58.97%, ANET +44.16%, HPE +180.63%
- Peer multiples (T4 sources only — treat as approximate): CSCO ~22–27x forward, ANET ~47x, HPE ~12x
- Cisco's historical/pre-AI P/E range: NOT available in the evidence — the fundamentals search explicitly states the historical range is unavailable from primary sources; any reference to prior norms is an assumption
- Revision momentum pre-print: 22 EPS up vs 0 down over 3 months (Seeking Alpha [T4])
Catalysts and risks
Catalysts
- FY27 Q1 earnings ~Nov 10, 2026 (est. EPS $1.18–1.34 range per calendar vs guide $1.32–1.34; AI order number is the key disclosure)
- Quarterly AI infrastructure order prints vs the ~$2B/quarter sustainability threshold
- Gross margin trajectory: whether Q2 FY27 guide holds ≥65% or slides further
- Hyperscaler capex commentary from MSFT/GOOG/AMZN/META prints through Oct–Nov 2026
- Potential analyst price-target resets as FY27 models absorb the +6–9% EPS revision
- Any enterprise/sovereign AI Ethernet design-win announcements broadening the demand base beyond hyperscalers
Risks
- AI order lumpiness: a sub-$2B order quarter would break the supercycle narrative mechanically
- Structural margin dilution: AI hardware mix could push gross margin below the 65% floor, capping EPS growth below revenue growth
- Concentration: bulk of AI orders from a handful of hyperscalers whose capex plans can pause
- Multiple risk: at ~22x forward, compression to 18x implies ~-20% (~$91) and to 16x implies ~-27% (~$81) on $5.08 EPS; the assumption that Cisco's fair multiple sits below 22x rests on pre-AI norms that are NOT sourced in this evidence — treat as assumption, not fact
- Memory/component cost inflation persisting longer than guided
- Services revenue stagnation signaling core enterprise weakness masked by AI hardware
- Key evidence gaps: peer multiples (ANET ~47x, HPE ~12x) and margin-driver attribution rest on T4 sources; Cisco's own historical P/E range is entirely absent from the evidence; no primary transcript quotes or post-earnings analyst compendium were obtained
What to watch
- Quarterly AI order number vs the ~$2B/quarter flywheel threshold — the single most important disclosure
- Non-GAAP gross margin: actuals and forward guide vs the 65–66% band
- Ratio of AI orders to AI revenue recognition (backlog conversion pace)
- Analyst FY27 EPS revision velocity post-print — consensus should converge from ~$4.70 toward ~$5.10 within weeks; if it doesn't, the Street doubts the guide
- Security/Splunk segment growth rates and services revenue stabilization
- ANET's multiple and AI commentary as the relative-value anchor (with the caveat that the specific 47x figure is T4-sourced)
- Volume-normalized price recovery: reclaiming the $117–120 area (50d/20d SMAs) would confirm the flush is over
Market snapshot when the call was made 2026-08-13
Price
| Return 1w | -6.1% |
| Return 1m | +1.5% |
| Return 3m | +11.4% |
| Return 6m | +32.6% |
| Return 1y | +59.0% |
| From 52-week high | -12.7% |
| Realized vol, 20d | 42.5% |
| SPY 3m / 1y | +4.8% / +21.0% |
| QQQ 3m / 1y | +2.4% / +26.2% |
Technicals
CSCO technicals as of 2026-08-13: last close $113.47; 20d SMA 116.40 (bearish); 50d SMA 117.72; 12d EMA 118.65; 26d EMA 117.32; RSI 14 48.9 (balanced); 20d vol 41.1%; volume x2.7 vs 20d avg
Next earnings: 2026-11-10
Verifier notes REVISE · opinion revised once
Unsupported claims
- 'Cisco's own historical 13–16x' multiple range (used in answer, thesis, bear_case, and risks): the evidence bundle contains no historical P/E range for Cisco. The fundamentals search explicitly states 'the exact current forward P/E and historical range are not fully available from the primary sources.' This range is load-bearing — the bear case's multiple-compression target and the risks section's '20–25% downside to multiple normalization' both rest on it — yet it appears nowhere in the evidence.
- 'the stock nearly doubled in a year while ANET tripled-ish and HPE re-rated harder' (why_this_matters): the quant evidence shows CSCO +58.97% 1y (the opinion's own key_evidence says +59%), ANET +44.16% 1y — i.e., CSCO actually OUTPERFORMED ANET by ~15pp over 1y, and ANET did not come close to tripling. Only the HPE claim (+180.63% 1y) is supported. The T4 TIKR headline 'nearly doubled' is contradicted by the opinion's own primary price data.
Weakly sourced
- Peer multiples (ANET ~47x, HPE ~12x) rest solely on T4 sources — the opinion does flag this in key_evidence and risks, which is adequate handling, but the ANET 47x comparison is repeated as a central pillar of the bull case and market_expectation without the caveat attached at each use.
Internal inconsistencies
- Risks section: '22x forward vs 13–16x historical range leaves ~20–25% downside to multiple normalization alone' — the arithmetic doesn't match the stated range: compression from 22x to 16x is -27% and to 13x is -41%, not 20–25%. The stated downside band is inconsistent with the opinion's own numbers.
- key_evidence states CSCO 1y return of +59% while why_this_matters claims the stock 'nearly doubled in a year' — the opinion contradicts itself.
Corrections applied
- Remove or properly source the 'historical 13–16x' range. Either (a) drop the specific range and state the multiple is elevated versus Cisco's pre-AI norms as an explicitly labeled assumption, or (b) obtain a sourced historical P/E series. The bear case and risks must not anchor price targets to an unsourced range.
- Fix why_this_matters to match the evidence: 'the stock is up ~59% in a year, roughly in line with ANET (+44%) and far behind HPE's re-rating (+181%)' — or simply delete the comparative performance clause.
- Reconcile the downside math in risks: at 22x, normalization to 16x implies ~-27% (~$83 on $5.08 EPS) and to 13x implies ~-41% (~$66); either update the '20–25%' figure or restate the target multiple that produces 20–25% (~17x).
- Attach the T4/approximate caveat to the ANET ~47x comparison where it appears in the bull case and market_expectation, not only in key_evidence.
Sources (37 · T1 = primary filings)
- T1https://investor.cisco.com/news/news-details/2026/CISCO-REPORTS-FOURTH-QUARTER-AND-FISCAL-YEAR-2026-EARNINGS/d…
- T1https://investor.cisco.com/files/doc_events/2025/11/1/Q1-26-Earnings-Slides.pdf
- T4https://www.alpha-sense.com/earnings/csco/
- T4https://247wallst.com/cards/cisco-systems-q4-2026-earnings-csco-01kzvsyh42k1sf6q1prgdtq2eq
- T4https://www.unite.ai/cisco-books-4b-in-quarterly-ai-orders-as-networking-supercycle-lifts-fy2027-outlook/
- T4https://www.investing.com/news/company-news/cisco-q4-fy2026-slides-ai-orders-surge-45x-networking-supercycle-9…
- T4https://www.piptheory.com/research/cisco-q4-2026-earnings-preview-ai-orders-us500
- T4https://www.aol.com/articles/cisco-says-ai-boom-forcing-122000000.html
- T3https://www.cnbc.com/2026/08/12/ciscos-stock-drops-despite-earnings-revenue-beat.html
- T4https://www.investing.com/news/company-news/cisco-q4-fy26-slides-ai-orders-surge-45x-shares-dip-on-margins-93C…
- T4https://www.marketbeat.com/earnings/reports/2026-8-12-cisco-systems-inc-stock/
- T4https://www.mexc.co/crypto-pulse/article/cisco-beat-earnings-so-why-is-csco-stock-down-after-hours-138383
- T4https://www.top1markets.com/news/cisco-csco-stock-q4-earnings-ai-orders-still-a-good-buy-f28
- T4https://www.linkedin.com/pulse/cisco-systems-inc-csco-q4-fy-2026-earnings-analysis-0400-faisal-amjad-s7xdf
- T4https://www.marketscreener.com/news/cisco-stock-falls-after-hours-as-services-revenue-miss-overshadows-record-…
- T4https://www.tikr.com/blog/ciscos-stock-has-nearly-doubled-in-a-year-the-ai-infrastructure-order-book-that-made…
- T4https://finance.yahoo.com/markets/stocks/articles/prediction-50-ytd-cisco-end-143022057.html
- T4https://www.alibaba.com/product-insights/100-cisco-systems-stock-quote-insights-analysis-for-2026.html
- T4https://flash.stocksentinel.ai/research/CSCO
- T4https://www.perplexity.ai/finance/CSCO
- T4https://247wallst.com/investing/2026/08/02/prediction-up-50-ytd-cisco-will-end-the-year-at-this-price/
- T4https://stockanalysis.com/stocks/csco/statistics/
- T4https://api.finexus.net/reports/slides_CSCO_20260408_235729
- T4https://www.gurufocus.com/news/9029843/cisco-systems-inc-csco-q4-2026-earnings-call-highlights-record-revenue-…
- T4https://earningscalls.dev/transcripts/cisco-systems-inc_csco_earnings_call_transcript_2026-06-04
- T1https://investor.cisco.com/events-and-presentations/event-details/2026/Cisco-Q4FY26-Earnings-Results/default.a…
- T4https://seekingalpha.com/article/4935679-cisco-systems-inc-csco-q4-2026-earnings-call-transcript
- T4https://finance.yahoo.com/quote/CSCO/earnings/CSCO-Q4-2026-earnings_call-668273.html
- T4https://www.marketscreener.com/news/transcript-cisco-systems-inc-q4-2026-earnings-call-aug-12-2026-ce7859d8d08…
- T4https://www.investing.com/news/transcripts/earnings-call-transcript-cisco-beats-on-q4-2026-results-shares-fall…
- T4https://newsroom.cisco.com/c/r/newsroom/en/us/a/y2026/m08/cisco-reports-fourth-quarter-earnings.html
- T4https://www.marketbeat.com/instant-alerts/cisco-systems-nasdaqcsco-issues-fy-2027-earnings-guidance-2026-08-12…
- T4https://www.tikr.com/blog/cisco-stock-is-rising-again-the-9-billion-ai-bet-could-be-behind-it
- T4https://qz.com/cisco-earnings-q4-2026-record-results-stock-drops-081326
- T4https://www.investing.com/news/stock-market-news/cisco-forecasts-upbeat-annual-revenue-4856000
- T4https://www.msn.com/en-us/money/economy/cisco-stock-falls-on-margin-concerns-here-s-what-wall-street-analysts-…
- T4https://scanx.trade/stock-market-news/companies/cisco-q4-results-conference-call-set-for-aug-12-to-discuss-fy2…
Want a fresh look at CSCO, or another name?
Queue a new deep-research run. Published to the feed when done.
Automated research opinion, published as-is on Aug 13, 2026. Not personalised advice. Figures use end-of-day closes.