Oversold into a binary — lean long.
Thesis
Bull case
Q3 beats guided-above-consensus numbers, external foundry revenue inflects, a named Tier-1 18A/14A customer (Apple via 14A is the most-cited) gets confirmed, and foundry losses keep shrinking ~$350M/quarter. Estimates chase upward again, and the stock re-rates toward $120-145 (from the Street mean zone up to BofA's $145 target, with KeyBanc at $155 as the high-end outlier) with the government stake as strategic sentiment support.
Bear case
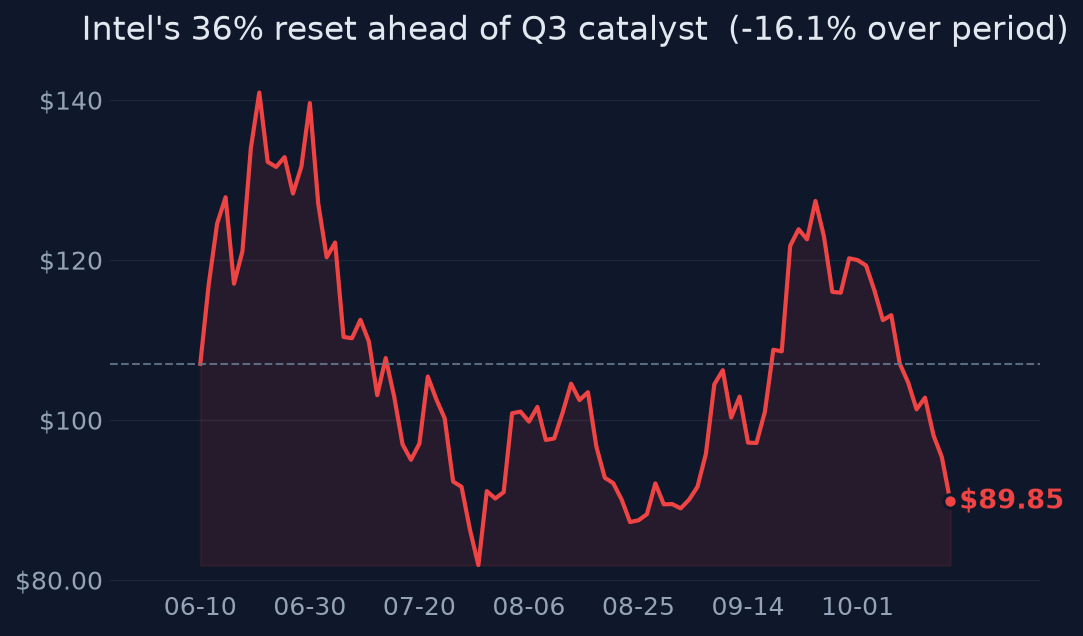
At $486B market cap (~9x 2025 sales), the stock requires flawless multi-year execution from a company with flat revenue since 2021, negative GAAP operating income in 2024-25, and a foundry losing $8B+/year with only $293M of external revenue. Strategic-entry prices (~$20-23) offer no downside anchor at $92; if the ~$23B equity raise is confirmed, dilution further strains per-share math, and any 18A yield slip, delayed customer win, or Q3 guide-down meets a 2.2-beta stock already in a downtrend, with JPMorgan's $85 target as the near marker and far lower if the option-value premium unwinds.
What would change our mind
- Q3 2026 external foundry revenue flat-to-down vs $293M with no named customer — the merchant-foundry bridge thesis is stalled
- Q4 guidance below Q3 guide ($15.8-16.8B) or foundry operating loss widening again — the fundamental inflection is broken
- Confirmation of equity issuance materially larger than the stock price has absorbed
- 18A yield timeline slipping past end-2026
Since publication vs SPY · closed horizons are frozen
The full research everything the view rests on
Direct answer to the question asked
Where the edge would come from
What the price assumes
At $92 the market prices ~44x 2027 consensus EPS ($2.08) — it assumes the 2026 revenue inflection persists, 18A ramps cleanly, and at least some of the rumored Apple/Broadcom/NVIDIA engagements convert to real external revenue. It no longer assumes confirmed mega-foundry wins (that was the $140 price).
Why the market may be wrong
Two directions. Bullish: the market treats NVIDIA's $5B as spent option value, but the product partnership plus 14A's far better IP-readiness (~85-90% of blocks vs ~15% for early 18A) mean external wins are more likely a 2027 event the market isn't paying for. Bearish: the market may be underweighting the reported ~$23B equity raise — if confirmed, per-share math at $486B market cap is far more demanding than headline P/E suggests.
The one thing to watch
Stop watching Intel's EPS and watch one line: external foundry revenue ($293M in Q2). The entire $486B valuation is a bridge from 'internal fab with $2.1B quarterly losses' to 'merchant foundry,' and that single line — not the headline beat — is the only quarterly data point that measures whether the bridge is being built. Everything else (government stake, NVIDIA, 18A yields) is staging.
Key evidence (11)
- Q2 2026: revenue $16.13B, +25.2% YoY vs ~$14.4B consensus; adj EPS $0.42 vs $0.21 [T2 Reuters, Jul 23 2026]
- Q3 2026 guided $15.8-16.8B revenue and $0.38 non-GAAP EPS, above consensus ~$15.1B/$0.27 [T2 Reuters]
- 2027 EPS consensus $2.08, revised up ~35% in 90 days [T4 aggregation]
- Intel Foundry Q2 2026: revenue $5.8B, operating loss $2.1B (improved $348M QoQ); external foundry revenue only $293M [T1 SEC 8-K]
- 18A output ~25% above target; yields expected at industry standard by end-2026 [T1/T4]
- US government: $8.9B for ~9.9% (433.3M shares, ~$20.5/share), plus 5% warrant if foundry ownership <51% [T2]
- NVIDIA $5B equity at $23.28/share — product partnership, NO confirmed wafer commitment to Intel Foundry; strategic entry prices in the low $20s are sentiment support, not a valuation floor [T4, key caveat]
- Apple/Broadcom/Microsoft/NVIDIA foundry engagements are KeyBanc-cited reports, unconfirmed by customers or Intel [T3/T4 — weakly sourced]
- Reported ~$23B equity raise driving the Sept-Oct selloff [T4 only — decision-critical, must verify against filings]
- Technicals: RSI 21, -17% 1m, -36% below 52w high; beta 2.2, realized vol 65-76% [computed]
- Street: mean targets $109-120 (range $50-200); consensus Hold-leaning; JPMorgan Hold/$85 vs KeyBanc Buy/$155 [T3]
Catalysts and risks
Catalysts
- Q3 2026 earnings ~Oct 29, 2026 (one source said Oct 22 — verify): headline beat/miss plus external foundry revenue and Q4 guide
- Confirmation or denial of named external 18A/14A customers (Apple, Broadcom, NVIDIA, Microsoft)
- 18A yield reaching industry-standard levels by end-2026
- Any disclosure clarifying the size/pricing of the reported ~$23B equity issuance
- US government policy developments around the stake/warrant and CHIPS support
Risks
- Foundry remains deeply loss-making ($2.1B/qtr) with minimal external revenue — the core business does not support the valuation
- Unverified ~$23B dilution claim resting on T4 sourcing
- Customer 'wins' are analyst-report allegations, not contracts; a no-news Q3 on this front could disappoint
- Political dependency: the national-champion premium is policy-cycle sensitive and unquantifiable
- Extreme volatility (65-76% realized) makes timing risk dominate thesis risk over 3-6 months
What to watch
- External foundry revenue line in the Q3 release (the single most important number)
- Q4 revenue/EPS guidance vs the guided Q3 base
- Foundry operating loss trajectory (expect continued ~$300M+/qtr improvement)
- Any customer-named press releases or 8-Ks on 14A
- SEC filings clarifying share count and the reported equity raise
- Whether the stock holds the $85-90 zone (JPMorgan target / recent support) into the print
Market snapshot when the call was made 2026-10-19
Price
| Return 1w | -14.2% |
| Return 1m | -17.4% |
| Return 3m | -7.4% |
| Return 6m | +31.2% |
| Return 1y | +141.9% |
| From 52-week high | -36.2% |
| Realized vol, 20d | 65.4% |
| SPY 3m / 1y | +2.9% / +14.8% |
| QQQ 3m / 1y | +2.0% / +17.9% |
Technicals
INTC technicals as of 2026-10-19: last close $92.03; 20d SMA 111.07 (bullish); 50d SMA 102.98; 12d EMA 101.75; 26d EMA 105.19; RSI 14 20.9 (oversold); 20d vol 46.4%; volume x1.0 vs 20d avg
Verifier notes REVISE · opinion revised once
Internal inconsistencies
- The thesis claims 'the national champion + option value floor near the government/NVIDIA entry economics likely limits downside to the $70s.' The evidence shows the government bought at ~$20.5/share ($8.9B / 433.3M shares) and NVIDIA at $23.28/share. Entry economics in the low $20s cannot logically anchor a floor in the $70s — the cited support levels contradict the conclusion drawn from them. If any price floor is defensible it would be recent technical support / JPMorgan's $85 target (which the opinion itself cites in what_to_watch), not the strategic investors' entry prices.
- Bull case states a re-rate 'toward $120-145 (Street mean to BofA/KeyBanc targets)' but KeyBanc's target is $155, not within the $120-145 range; the parenthetical misattributes the range endpoints.
Corrections applied
- Fix the downside-floor argument: either drop the 'government/NVIDIA entry economics' justification (those entries were ~$20-23, far below $70s) or re-anchor the floor on recent support and the $85 JPMorgan target, acknowledging the strategic-entry prices provide sentiment/optionality support rather than a valuation floor.
- Correct the bull-case range attribution to 'Street mean to BofA target ($145), with KeyBanc at $155 as the high-end outlier' or extend the stated range accordingly.
Sources (24 · T1 = primary filings)
- T4https://axis-intelligence.com/intel-statistics/
- T4https://semiconductorx.com/spotlight-intel-foundry.html
- T4https://finance.yahoo.com/technology/ai/articles/intel-vs-tsmc-one-chip-220337230.html
- T4https://insightnodes.com/technology/intel
- T4https://whatledto.com/who/intel
- T4https://insightnodes.com/technology/intel/report
- T4https://sectally.com/reports/intc/
- T4https://x.com/XTexchange/article/2100527124843299276
- T4https://finance.yahoo.com/quote/INTC/earnings/INTC-Q2-2026-earnings_call-653928.html/
- T1https://www.sec.gov/Archives/edgar/data/50863/000005086326000155/q226earningsrelease.htm
- T4https://finance.yahoo.com/quote/INTC.VI/earnings/INTC.VI-Q2-2026-earnings_call-653928.html
- T4https://finance.yahoo.com/quote/1INTC.MI/earnings/1INTC.MI-Q2-2026-earnings_call-653928.html
- T4https://naslovi.net/2026-10-15/streberi/intel-osvaja-ugovore-sa-broadcomom-googleom-appleom-i-nvidiom/42492395
- T4https://finance.yahoo.com/quote/INL.F/earnings/INL.F-Q2-2026-earnings_call-653928.html
- T4https://finance.yahoo.com/quote/4335.HK/earnings/4335.HK-Q2-2026-earnings_call-653928.html
- T4https://x.com/Alex_Intel_/status/2103145329889857774
- T4https://finance.yahoo.com/markets/stocks/articles/intc-stock-watch-earnings-october-181941210.html
- T3https://www.barrons.com/market-data/stocks/intc/research-ratings
- T4https://www.investing.com/equities/intel-corp-consensus-estimates
- T3https://www.marketwatch.com/investing/stock/intc/analystestimates
- T2http://rmb.reuters.com/rmd/rss/item/tag:reuters.com,2026:newsml_MT1USDAYNETOH92289514007?channel=iae739
- T4https://finance.yahoo.com/quote/INTC/analyst-insights/
- T4https://finance.yahoo.com/markets/stocks/articles/intel-break-moment-happens-intc-120049204.html
- T4https://www.marketbeat.com/stocks/NASDAQ/INTC/forecast/
Want a fresh look at INTC, or another name?
Queue a new deep-research run. Published to the feed when done.
Automated research opinion, published as-is on Oct 19, 2026. Not personalised advice. Figures use end-of-day closes.