Elevated bar; guidance is the swing factor.
Thesis
Bull case
A third consecutive guidance raise (Core FFO >$6.30) with occupancy at/above ~95.5% and accelerating U.S. market rents proves the de-rating was a rates artifact, not a fundamentals verdict; supply pipelines are shrinking (e.g., Nashville construction down 40% QoQ), absorption is improving, and data-center demand adds incremental logistics need. Off a multiple already down 30–40%, a clean raise could drive outsized re-rating given light positioning.
Bear case
The raises are lower quality than they look — promote-driven, with recurring strategic-capital revenue flat — and data-center expansion ($2.1bn H1 starts, 5.8GW pipeline) adds capital intensity and execution risk a logistics-REIT multiple shouldn't carry. With the Fed hiking and the 10-year at 5.2%+, even a Q3 beat with maintained guidance reads as momentum stalling, and the stock keeps grinding lower with the sector.
What would change our mind
- Bullish read invalidated if Q3 Core FFO beats but FY guidance is cut or occupancy falls below 95.25% — that confirms fundamentals, not rates, are the problem
- Bearish read invalidated if guidance rises above $6.30 with occupancy ≥95.5% and the stock still de-rates — that would confirm pure rate dominance and argue for adding on macro stabilization
- If FY27 consensus holds while the stock stays >15% below its 52-week high post-print, this is multiple compression, not deterioration
Since publication vs SPY · closed horizons are frozen
The full research everything the view rests on
Direct answer to the question asked
Where the edge would come from
What the price assumes
Consensus expects ~$1.58 Core FFO (~6% YoY), revenue ~$2.17–2.20bn, occupancy improving within the 95.25–95.75% full-year framework, leasing near the 60–65M sq ft pace, and the $6.22–$6.30 Core FFO guide held or raised. The modest pre-earnings bid (+3.8% last week vs flat SPY) and recent upward EPS revisions suggest positioning is cautiously optimistic but not crowded.
Why the market may be wrong
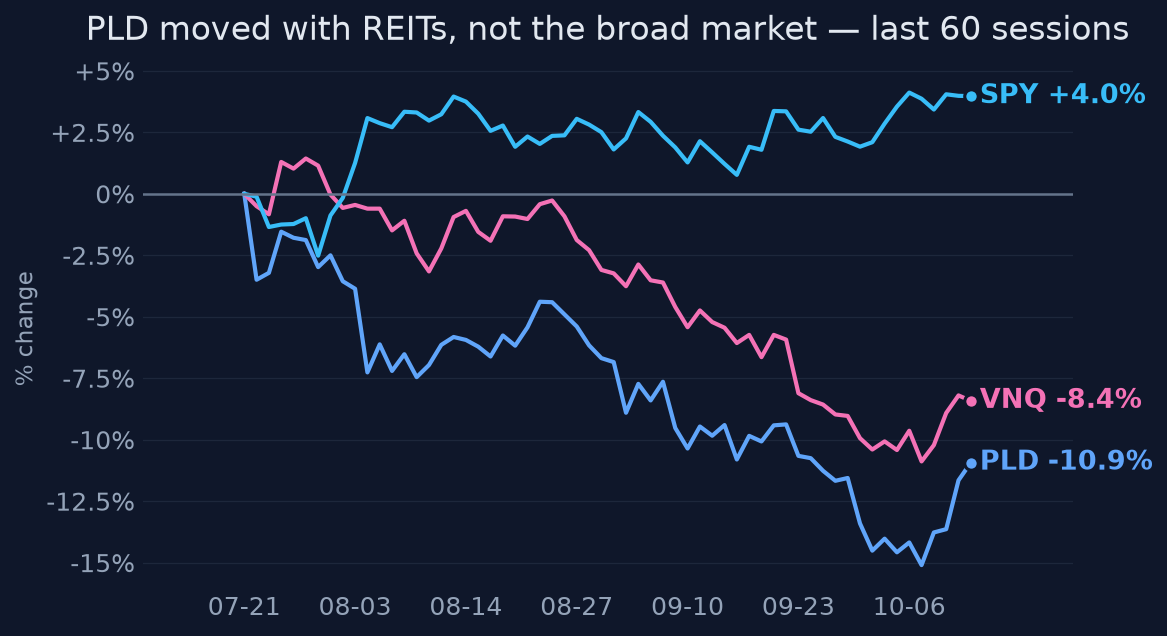
If the drawdown is genuinely a rates/sector artifact (PLD matched VNQ exactly over 3 months; 99% idiosyncratic share vs SPY), then company-level evidence — two raises, record leasing, 6.75–7.25% cash same-store NOI growth — is being underpriced, and the 30–40% multiple de-rating from late 2025 already embeds much of the rate damage. Conversely, bulls may be wrong if the raises lean on volatile promote income ($83M in Q2, now guided ~flat for the year) while recurring strategic-capital revenue stayed flat at $660–680M — meaning the 'beat-and-raise' story is lower quality than the headline numbers imply.
The one thing to watch
Stop watching the Core FFO beat/miss — PLD's correlation to SPY has collapsed to 0.12 and it has traded as a pure rates/REIT-sector instrument (matching VNQ tick-for-tick), so the earnings variable that actually moves the stock is the guidance range itself: above $6.30 breaks the rate-shackle narrative, at-or-below confirms the market's quality-of-growth discount. The number to watch is the guide's midpoint, not the quarter.
Key evidence (6)
- Q2 2026 (Jul 16, 2026): Core FFO $1.63 vs ~$1.55 consensus; record leasing; FY26 Core FFO guide raised a second time to $6.22–$6.30 [T1: PLD IR release/SEC 8-K exhibit]
- Q3 consensus: ~$1.58 Core FFO, ~$2.17–2.20bn revenue; occupancy guide 95.25–95.75%; development starts guide $5.5–6.5bn [T4 — consensus aggregation, definitional ambiguity between GAAP EPS and Core FFO flagged in sources]
- Price action: −6.9% over 3m, −11% below 52w high, +22.9% 1y; 3m spread vs SPY −10pts but exactly in line with VNQ (−6.87%); 60d correlation to SPY 0.12, 99% idiosyncratic share [computed from daily price history]
- Q2 raise mix: $83M promote income, full-year promotes now ~flat; strategic capital revenue ex-promotes unchanged at $660–680M [T1: SEC filing]
- Macro (Oct 2026): Fed funds 3.75–4.00% after a hike; 10-year ~5.21%, highest since 2002, +120bp YTD; market prices ~3 more hikes over 12 months [T2/T1]
- Forward P/E ~29x vs 48.5x at Dec 2025 — a 30–40% de-rating [T4 data series]
Catalysts and risks
Catalysts
- Q3 2026 earnings pre-market Oct 15, 2026 — Core FFO vs ~$1.58 and, critically, any change to the $6.22–$6.30 guide
- Occupancy print vs 95.25–95.75% framework and U.S. market-rent growth trajectory
- Leasing volume (vs 60–65M sq ft pace) and inquiry pipeline (>100M sq ft)
- FOMC decision Oct 28, 2026 (market prices 19% hike odds) and 10-year Treasury path
- Data-center starts-to-stabilization conversion evidence
Risks
- Beat-and-maintain guidance interpreted as stalled momentum after two raises
- Further rate increases (market prices ~3 hikes over 12 months) compressing the premium multiple
- Elevated industrial deliveries pressuring occupancy, concessions, and mark-to-market rents in oversupplied markets
- Promote income volatility making headline FFO beats lower quality
- Data-center execution/power-availability risk consuming capital without near-term recurring FFO
What to watch
- FY26 Core FFO guidance midpoint vs $6.26 — the single decisive number
- Occupancy vs 95.5% and net-effective rent spreads on new leases
- Cash same-store NOI growth vs 6.75–7.25% guide
- Promote income contribution to any beat vs recurring rental/management-fee growth
- 10-year Treasury yield and Fed language into Oct 28 FOMC
- Development starts pace and data-center capital commitments vs contributions/dispositions
Market snapshot when the call was made 2026-10-13
Price
| Return 1w | +3.8% |
| Return 1m | -1.2% |
| Return 3m | -6.9% |
| Return 6m | -2.8% |
| Return 1y | +22.9% |
| From 52-week high | -11.0% |
| Realized vol, 20d | 17.5% |
| SPY 3m / 1y | +3.1% / +19.1% |
| QQQ 3m / 1y | +3.6% / +26.1% |
Technicals
PLD technicals as of 2026-10-13: last close $133.55; 20d SMA 131.86 (bearish); 50d SMA 136.42; 12d EMA 131.03; 26d EMA 132.82; RSI 14 48.7 (balanced); 20d vol 16.6%; volume x1.2 vs 20d avg
Sources (32 · T1 = primary filings)
- T1https://ir.prologis.com/news-events/press-releases/detail/1053/prologis-to-announce-third-quarter-2026-results…
- T1https://ir.prologis.com/ical?id=24100
- T1https://ir.prologis.com/
- T4https://finance.yahoo.com/real-estate/articles/prologis-stock-q3-earnings-smart-135500404.html
- T4https://www.investing.com/news/earnings/prologis-set-to-report-earnings-amid-warehouse-market-rebound-93CH-494…
- T1https://ir.prologis.com/news-events/events-presentations/detail/20261015-prologis-q3-2026-earnings-conference-…
- T4https://zolmax.com/investing/prologis-pld-set-to-release-earnings-on-thursday/12028565.html
- T4https://www.perplexity.ai/finance/PLD/earnings
- T4https://www.cushmanwakefield.com/en/united-states/insights/us-marketbeats/dallas-ft-worth-marketbeats/industri…
- T4https://www.cbre.com/insights/figures/nashville-industrial-figures-report-q3-2026
- T4https://www.cushmanwakefield.com/en/united-states/insights/us-marketbeats/chicago-marketbeats/industrial
- T4https://www.cushmanwakefield.com/en/united-states/insights/us-marketbeats/indianapolis-marketbeats/industrial
- T4https://www.cushmanwakefield.com/en/united-states/insights/us-marketbeats/phoenix-marketbeats/industrial
- T4https://www.cushmanwakefield.com/en/united-states/insights/us-marketbeats/houston-marketbeats/industrial
- T4https://www.cbre.com/insights/figures/charlotte-industrial-figures-q3-2026
- T4https://www.cushmanwakefield.com/en/united-states/insights/us-marketbeats/boise-marketbeats/industrial
- T1https://www.sec.gov/Archives/edgar/data/0001045609/000119312526305416/pld-ex99_2.htm
- T1https://www.sec.gov/Archives/edgar/data/1045609/000119312526305416/pld-ex99_2.htm
- T4https://www.sahmcapital.com/news/content/prologis-q2-2026-earnings-call-complete-transcript-2026-07-16
- T1https://ir.prologis.com/news-events/press-releases/detail/1036/prologis-reports-first-quarter-2026-results
- T4https://finance.yahoo.com/quote/POJN.SG/earnings/POJN.SG-Q2-2026-earnings_call-650301.html
- T4https://finance.yahoo.com/quote/PRLD.VI/earnings/PRLD.VI-Q2-2026-earnings_call-650301.html/
- T4https://finance.yahoo.com/quote/PLD/earnings/PLD-Q2-2026-earnings_call-650301.html
- T1https://ir.prologis.com/financials/sec-filings/content/0001193125-26-157977/pld-ex99_2.htm
- T1https://www.federalreserve.gov/releases/H15//default.htm
- T1https://www.federalreserve.gov/releases/h15/
- T2https://www.reuters.com/business/lower-us-treasury-yield-view-persists-despite-biggest-quarterly-surge-since-1…
- T4https://alfred.stlouisfed.org/release?rid=18&rd=2026-10-26
- T2https://www.bloomberg.com/news/articles/2026-10-13/treasuries-gain-on-haven-demand-as-trading-resumes-after-ho…
- T4https://www.bbvaresearch.com/wp-content/uploads/2026/10/US_Interest_Rates_Monitor_October_26_ENG.pdf
- T1https://home.treasury.gov/resource-center/data-chart-center/interest-rates/daily-treasury-rates.csv/2026/all?t…
- T3https://www.morningstar.com/news/dow-jones/20261013616/us-treasury-yields-fall-as-markets-look-to-us-inflation…
Want a fresh look at PLD, or another name?
Queue a new deep-research run. Published to the feed when done.
Automated research opinion, published as-is on Oct 14, 2026. Not personalised advice. Figures use end-of-day closes.