Calm tape, thin cushion.
Thesis
Bull case
The rally is backed by real earnings, not multiple expansion: the P/E sits at ~19x (well-sourced [T3]) and press coverage indicates it has de-rated from ~22x [T4] while Q3 estimates were revised up 2.8pts in a quarter; CY 2027 growth of ~15.8% gives a PEG near 1.2, breadth is broadening (equal-weight leading YTD), and Mag 7 earnings are expected to stabilize rather than collapse into 2027. AI capex at +33% is fuel for the entire index's earnings chain, and if the Fed merely holds (not hikes) while revisions continue, the de-rating-while-rising pattern can persist — making 19x look cheap in hindsight.
Bear case
The equity risk premium is ~zero (5.3% earnings yield vs 5.3% 10y) with a Fed whose next move skews toward a hike; a third of the index's value sits in 10 names whose earnings must clear a +29.5% Q3 bar and whose +33% capex plans face rising ROI scrutiny; on one [T4] framing, growth decelerates sharply into 2027 (~35%→~15%), though FactSet's [T3] ~23% CY2026 figure would imply a milder deceleration — the direction is the same either way; and the tape's 33rd-percentile vol at record highs suggests complacency. A single inflation surprise or mega-cap capex guide-down hits the multiple and the discount rate at once — the -9.2% max drawdown this year is not a good guide to the tails.
What would change our mind
- The 10-year falls back below ~4.75% on soft inflation while earnings revisions stay positive — ERP reopens and the bearish asymmetry disappears
- Q3 2026 earnings beat the +29.5% bar with raised capex guidance and CY 2027 estimates revised higher — the earnings-led de-rating thesis gains another leg
- December FOMC pivots to an explicit easing bias — removes the discount-rate overhang
- If the index rises above street targets (>8,000 S&P, VOO >~735) on broadening breadth with RSP outperforming, the concentration/valuation concern is empirically refuted
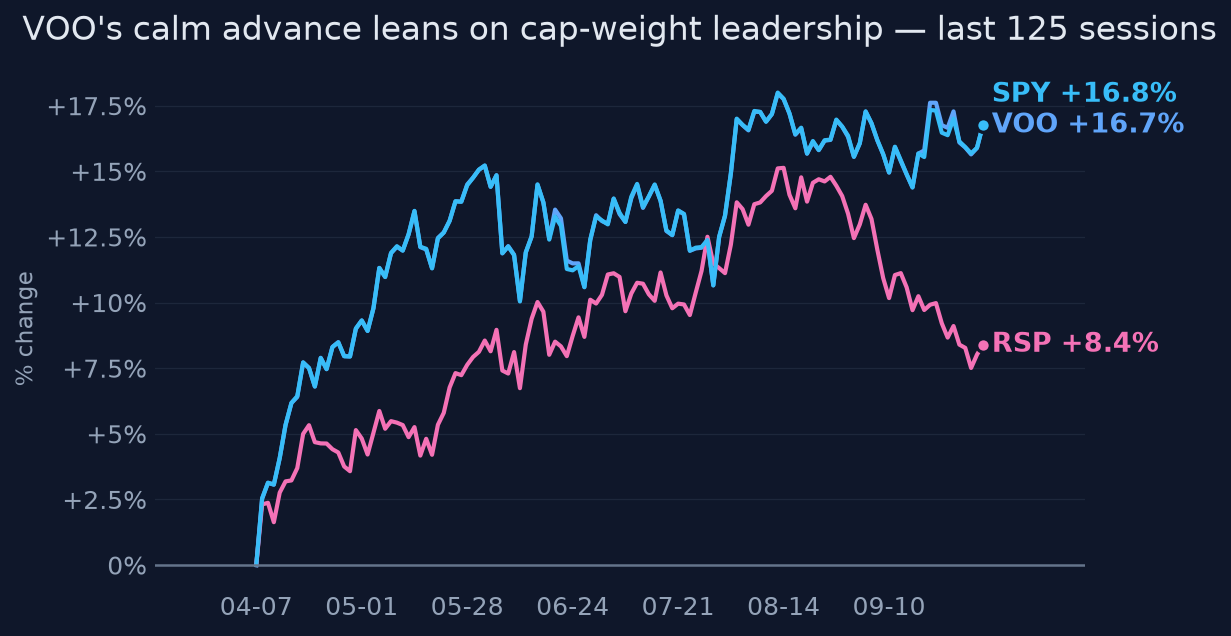
Since publication vs SPY · closed horizons are frozen
No price data after the entry date yet.
The full research everything the view rests on
Direct answer to the question asked
Where the edge would come from
What the price assumes
At 712 (0.4% below the 52-week high, 33rd-percentile realized vol), the market is pricing continued earnings delivery against a benign 'higher-for-longer' backdrop — December FOMC futures center on a hold at 4.00-4.25%. Sell-side targets (Goldman and Morgan Stanley 8,000 for YE 2026; MS 8,300 mid-2027) imply the street itself only underwrites ~3% upside to year-end and ~6-7% to mid-2027, even while remaining rhetorically bullish.
Why the market may be wrong
Two-sided. Consensus may be too cautious: revisions are still going up (Q3 estimate raised from +26.7% to +29.5% since June), breadth is improving (equal-weight +13% vs cap-weight +8.5% YTD per Reuters), and press coverage indicates the P/E has fallen even as price rose — this is not a multiple-expansion bubble, it's an earnings-led market trading at a PEG near 1.2 on 2027 growth. Consensus may be too complacent: a zero ERP with a Fed whose next move is more likely a hike than a cut is historically fragile, and the +29.5% Q3 bar plus 33% concentration means one bad mega-cap capex print re-prices the whole index.
The one thing to watch
The variable to watch is not the P/E — it is the earnings-yield/Treasury crossover: at 1/19 ≈ 5.26% versus a 5.27% 10-year, the S&P 500's earnings yield has fallen below the risk-free rate while the Fed retains a hiking bias, so every incremental rise in yields now requires either multiple compression or even faster earnings upgrades just to stand still. If 2027 EPS estimates keep rising while the 10-year stays above ~5%, the index can grind higher on upgrades alone; if revisions flatten, there is no valuation buffer left.
Key evidence (10)
- VOO 712.32, -0.37% below 52w high, +15.8% 1y, +17.6% 6m; realized vol 10.8% (33rd percentile); max 1y drawdown -9.2% (market data, 2026-10-05)
- Forward P/E 19.0x per FactSet Earnings Insight 10/2/26 [T3] and JPM Guide to the Markets 9/30/26 [T3]; the ~22x earlier-2026 starting point rests on press coverage (Yahoo/historyofmarket [T4]) — the de-rating-during-a-rising-tape claim should be read with that sourcing split in mind
- Q3 2026 expected earnings growth +29.5%, revised UP from +26.7% on June 30; CY 2027 growth ~+15.8% (FactSet, 10/2/26 [T3])
- 10-year Treasury ~5.27-5.28% (Morningstar/Dow Jones 10/2/26 [T3], FRED [T4]); effective fed funds 3.88%, upper target 4.00% (Fed H.15/FRED [T1])
- December 2026 FOMC futures: base case hold at 4.00-4.25%, hike to 4.25-4.50% more likely than a cut (Investing.com fed monitor [T4], Reuters broker surveys [T2])
- Top 10 US stocks ~33% of market value; Mag 7 ~1/3 of S&P 500 weight (Reuters via Morgan Stanley [T2]); Mag 7 profits +63.2% y/y Q1 2026 (FactSet via Reuters [T2])
- S&P 500 capex forecast +33% in 2026 vs buybacks +3% (Goldman data via Reuters [T2]) — earnings story levered to AI capex durability
- Breadth improving but recent: equal-weight +13% vs cap-weight +8.5% YTD 2026 (Reuters 7/29/26 [T2]); yet RSP trailed VOO by 5pts over the trailing 1y (quant analysis)
- Strategist targets: Goldman 8,000 and Morgan Stanley 8,000 YE 2026; MS 8,300 mid-2027 (Reuters 5/27/26 [T2]) — stale (May vintage) but imply only ~3% upside from current ~7,750-7,800 index level
- Unresolved contradiction: CY 2026 earnings growth cited as ~23% (FactSet July [T3]) vs ~35% (247wallst [T4]) — likely definitional, not confirmed from primary sources; the ~35%→~15% 2027 deceleration framing rests solely on that T4 source
Catalysts and risks
Catalysts
- Q3 2026 earnings season beginning mid-October 2026 — Mag 7 results and AI capex commentary against a +29.5% growth bar
- November and December 2026 FOMC meetings — futures price hold as base case with hike risk; a hike would reprice the ERP from zero to negative
- Monthly CPI/PCE prints — any upside surprise forces simultaneous multiple and discount-rate repricing
- Further FactSet revision trend on CY 2027 estimates — flattening revisions remove the market's only support at zero ERP
Risks
- Fed hikes in December 2026 or signals 2027 tightening, pushing the 10y above ~5.5%
- Mega-cap AI capex guidance cut or ROI skepticism — top-10 names are ~33% of index value
- CY 2027 earnings revisions stall; the growth-deceleration narrative (steep ~35%→15% per the single [T4] framing, or milder off FactSet's ~23% CY2026 base [T3]) becomes dominant either way
- Breadth improvement reverses (RSP already lags VOO 1y), re-concentrating index risk
- Stale strategist targets (May 2026 vintage) may mask that even bulls see little upside — limited incremental buying rationale
What to watch
- The earnings-yield vs 10-year spread (currently ~0%) — the single cleanest gauge of valuation buffer
- FactSet weekly CY 2027 EPS revision direction through Q4
- Mag 7 capex guidance language in Q3 calls (mid-to-late October)
- RSP/VOO relative strength — confirmation or failure of the broadening narrative
- December FOMC futures distribution — shift from hold to hike as base case
- 10-year yield behavior around each CPI print; a break above ~5.5% is a red flag
Market snapshot when the call was made 2026-10-05
Price
| Return 1w | +1.2% |
| Return 1m | +0.2% |
| Return 3m | +3.7% |
| Return 6m | +17.6% |
| Return 1y | +15.8% |
| From 52-week high | -0.4% |
| Realized vol, 20d | 10.8% |
| SPY 3m / 1y | +2.4% / +15.1% |
| QQQ 3m / 1y | +6.6% / +24.8% |
Technicals
VOO technicals as of 2026-10-05: last close $712.32; 20d SMA 703.79 (neutral); 50d SMA 702.87; 12d EMA 705.82; 26d EMA 704.45; RSI 14 65.1 (balanced); 20d vol 10.6%; volume x0.6 vs 20d avg
Verifier notes REVISE · opinion revised once
Unsupported claims
- "drawdown risk from a discount-rate shock (5-10%)" (why_this_matters): this specific 5-10% range appears nowhere in the evidence bundle and is not derivable from any evidence figures (the only drawdown datum is the -9.2% realized max 1y drawdown, which the opinion itself says is not a guide to tails). It is presented as a quantified scenario and does real work in the core asymmetry argument, so a reader will treat it as evidence-backed when it is an analyst assumption.
Weakly sourced
- "Forward P/E has compressed from ~22x earlier in 2026 to ~19x" — the current 19.0x is well-sourced (FactSet 10/2/26 and JPM 9/30/26, both [T3]), but the ~22x starting point is supported only by [T4]-tagged Yahoo/historyofmarket coverage per the search results; the opinion's key_evidence bullet implies the whole de-rating claim rests on the T3 sources. The de-rating point is central to the 'earnings-driven, not multiple-driven' framing, so the 22x anchor should be tagged T4 or qualified.
- "growth decelerates sharply into 2027 (~35%→15%)" (bear_case and risks) — the ~35% CY2026 figure rests solely on a 247wallst [T4] note and directly contradicts the FactSet [T3] ~23% CY2026 figure; the opinion does flag this as 'one framing' and notes the unresolved contradiction in key_evidence, which partially mitigates, but the bear case still leans on the T4 number.
Corrections applied
- Either remove the '(5-10%)' from the discount-rate-shock drawdown claim, or explicitly label it as an illustrative scenario assumption (e.g., 'an assumed 5-10% drawdown') so it is not mistaken for an evidence-derived figure.
- In key_evidence, separate the sourcing: 'Forward P/E 19.0x per FactSet/JPM [T3]; down from ~22x earlier in 2026 per press coverage [T4]' — or drop the 22x anchor and state only that multiple outlets report a de-rating from ~22x.
- In bear_case/risks, keep the '~35%→15%' deceleration explicitly tied to its single [T4] framing and note the FactSet ~23% CY2026 alternative, as already done in key_evidence — ensure the bear case doesn't read as if 35% is the consensus base.
Sources (48 · T1 = primary filings)
- T4https://finance.yahoo.com/markets/stocks/articles/p-500-near-time-high-102700099.html
- T4https://finance.yahoo.com/markets/stocks/articles/wall-street-expects-p-500-130844687.html
- T4https://finance.yahoo.com/markets/stocks/articles/analysis-investors-wary-slowdown-us-093350262.html
- T3https://www.morningstar.com/news/marketwatch/20260107197/why-big-tech-stocks-are-so-much-more-attractive-than-…
- T4https://historyofmarket.com/sp500/forward-pe/
- T4https://am.gs.com/en-us/advisors/insights/article/market-monitor-weekly
- T4https://finance.yahoo.com/markets/article/why-sp-500-stock-valuations-are-falling-160016070.html
- T3https://www.barrons.com/market-data/stocks/us/pe-yields
- T1https://www.federalreserve.gov/releases/h15/
- T4https://tradingeconomics.com/united-states/government-bond-yield
- T4https://fred.stlouisfed.org/series/fedfunds
- T4https://fred.stlouisfed.org/series/dgs10
- T4https://finance.yahoo.com/economy/policy/articles/10-treasury-yield-hits-5-123000837.html
- T4https://www.forbes.com/advisor/investing/treasury-rates/
- T3https://www.morningstar.com/news/dow-jones/202610025719/10-year-treasury-yield-rises-to-5276-this-week-data-ta…
- T1https://home.treasury.gov/resource-center/data-chart-center/interest-rates/TextView?type=daily_treasury_real_y…
- T3https://advantage.factset.com/hubfs/Website/Resources%20Section/Research%20Desk/Earnings%20Insight/EarningsIns…
- T3https://advantage.factset.com/hubfs/Website/Resources%20Section/Research%20Desk/Earnings%20Insight/EarningsIns…
- T3https://insight.factset.com/topic/earnings
- T3https://advantage.factset.com/hubfs/Website/Resources%20Section/Research%20Desk/Earnings%20Insight/EarningsIns…
- T3https://advantage.factset.com/hubfs/Website/Resources%20Section/Research%20Desk/Earnings%20Insight/EarningsIns…
- T3https://insight.factset.com/topic/earnings/page/1
- T3https://advantage.factset.com/hubfs/Website/Resources%20Section/Research%20Desk/Earnings%20Insight/EarningsIns…
- T3https://advantage.factset.com/hubfs/Website/Resources%20Section/Research%20Desk/Earnings%20Insight/EarningsIns…
- T2https://www.reuters.com/business/magnificent-7-results-set-test-broadening-us-stock-market-2026-07-29/
- T2https://www.reuters.com/business/major-takeaways-magnificent-sevens-ai-fueled-earnings-2026-05-21/
- T2https://www.reuters.com/commentary/reuters-open-interest/stock-market-concentration-feature-not-bug-2026-05-11…
- T2https://www.reuters.com/technology/magnificent-seven/
- T4https://en.wikipedia.org/wiki/S&P_500
- T4https://www.theglobeandmail.com/investing/markets/stocks/TSLA/pressreleases/3269441/prediction-this-etf-will-b…
- T3https://www.spglobal.com/spdji/en/indices/equity/sp-500-top-10-index/
- T4https://www.theglobeandmail.com/investing/markets/markets-news/motley/3269441/prediction-this-etf-will-be-the-…
- T4https://247wallst.com/investing/2026/10/03/wall-street-expects-sp-500-profit-growth-to-collapse-from-35-to-15-…
- T4https://www.morganstanley.com/Themes/outlooks
- T3https://www.morningstar.com/news/marketwatch/2026052789/goldman-sachs-hikes-sp-500-target-and-rejects-bubble-e…
- T2https://www.reuters.com/business/goldman-sachs-lifts-sp-500-year-end-target-8000-strong-earnings-outlook-2026-…
- T4https://www.gulf-times.com/article/734611/business/if-a-bruising-third-quarter-cant-halt-wall-street-what-can
- T2https://www.reuters.com/business/finance/trend-mainstay-ai-cement-its-place-core-2026-investment-strategies-20…
- T4https://www.thestreet.com/investing/goldman-sachs-doubles-down-on-bold-sp-500-forecast
- T4https://finance.yahoo.com/markets/stocks/articles/goldman-raises-p-500-target-183150981.html
- T1https://www.federalreserve.gov/monetarypolicy/fomcpresconf20260916.htm
- T4https://www.investing.com/central-banks/fed-rate-monitor
- T4https://www.pnc.com/content/dam/pnc-com/pdf/aboutpnc/EconomicReports/EconomicUpdates/2026/PNC_Economics_Resear…
- T2https://www.reuters.com/business/finance/wall-street-brokerages-pencil-fed-rate-cuts-mid2026-2026-09-08/
- T2https://www.reuters.com/business/finance/wall-street-brokerages-pencil-fed-rate-cuts-mid2026-2026-09-15/
- T4https://www.schwab.com/learn/story/fomc-meeting
- T4https://www.kiplinger.com/investing/live/fed-meeting-updates-and-commentary-september-2026
- T1https://www.federalreserve.gov/monetarypolicy/fomccalendars.htm
Earlier and later calls on VOO
- Aug 10, 2026No edge — don't time it.No clear edgeview changed
Want a fresh look at VOO, or another name?
Queue a new deep-research run. Published to the feed when done.
Automated research opinion, published as-is on Oct 5, 2026. Not personalised advice. Figures use end-of-day closes.