Yes — derating looks overdone.
Thesis
Bull case
Fundamentals keep compounding (FY27 EPS $4.54 consensus, upward revisions), AV transition proves slow and Uber captures take rate on partner robotaxis at zero fleet capex, Waymo partnership survives or is replaced by Nuro/Avride/WeRide supply, and the multiple re-rates from 16-17x toward 18-20x (worth $82-91, ~15-30% upside) — and toward the $101-105 street consensus if the aggregator proof lands. The stock is 29% below its 52-week high with 20-day vol at the 6th percentile — coiled after the derating.
Bear case
Waymo terminates the Uber partnership and expands direct (it already prices 12.7% ABOVE Uber in SF and still gained 22% in-zone share — consumers will pay a premium for autonomy, meaning disintermediation isn't price-dependent). Tesla solves operations and uses its cost advantage (~$2/km) to force fare compression. Uber's $10B AV commitment dilutes FCF and signals the legacy moat is indefensible. The 10% layoff signals management sees structural, not cyclical, pressure. In that world 16x 'cheap' is a value trap on a declining-terminal-value asset.
What would change our mind
- Official Waymo-Uber partnership termination without a replacement supply deal of comparable scale
- Q3 or Q4 gross bookings growth decelerating below ~15% cc, breaking the >20% streak — would falsify 'fundamentals accelerating'
- Uber's category-share claim reverses: credible third-party data (YipitData/Wolfe) showing Uber losing citywide share in SF/LA/Phoenix, not just ceding AV zones
- FY27 EPS consensus ($4.54) revised downward materially — would confirm the derating is earnings-driven, not sentiment-driven
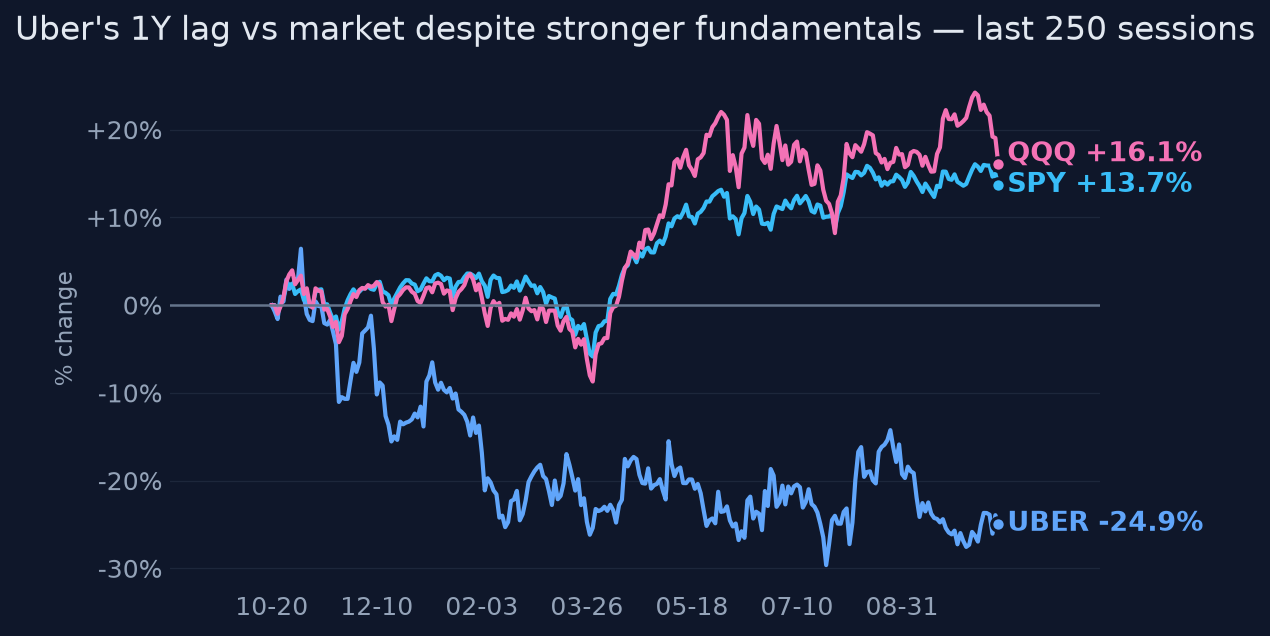
Since publication vs SPY · closed horizons are frozen
The full research everything the view rests on
Direct answer to the question asked
Where the edge would come from
What the price assumes
At 16-17x forward earnings — versus a 3-year trailing P/E average of ~41x — the market is pricing a material probability that robotaxis structurally impair Uber's mobility take rate and terminal cash flows within a few years. Consensus sell-side targets of $101-105 (45%+ upside) suggest the street thinks this derating is excessive, but the persistent discount says marginal buyers demand proof on AV economics before re-rating.
Why the market may be wrong
The market extrapolates Waymo's localized share gains (15-22% inside its SF/LA/Phoenix operating zones) into a platform-level death spiral, yet Uber reports its category share in those same markets — including inside AV zones — is up year over year, because AV supply expands the total market. Tesla robotaxi, the feared price disruptor at ~$2/km, runs ~25 unsupervised vehicles in three Texas cities with documented operational problems. The bear case conflates a real but slow, geography-bound transition with an imminent one.
The one thing to watch
The variable to watch is not Waymo's trip count — it's whether Uber's >$7.5B of vehicle/offtake commitments and multi-partner roster convert AV from a disintermediation story into a margin-accretive supply story: if 120,000 partner robotaxis materialize on Uber's platform, Uber captures the take rate on autonomous rides WITHOUT owning the capital-intensive fleet, which would mean today's multiple is pricing a threat that is actually a take-rate opportunity. The single point of failure is Waymo: it is simultaneously Uber's most valuable AV supply and its most credible disintermediator, and the reported September 2026 strain in that partnership is the highest-information event to monitor.
Key evidence (11)
- Q2 2026 (reported Aug 5, 2026): gross bookings $58.0B +22% cc (4th straight quarter >20% cc), adj. EBITDA $2.8B +33%, trips +18%, TTM FCF >$10B [T1 investor.uber.com]
- FY2025: revenue $52.0B (+18%), operating margin 10.7% vs 6.4% in FY24, EPS $4.73 [T1 SEC XBRL]
- Consensus: FY26 EPS $3.18, FY27 $4.54 (+43%), net upward revisions; forward P/E ~16-17x vs 3y trailing avg ~41x [T4 aggregators — treat exactly as tiered]
- Re-rating math: at $70.35, 18x FY27 consensus $4.54 = $81.72 (+16%); 20x = $90.80 (+29%); 21x = $95.34 (+35%) — sell-side consensus targets of $101-105 imply ~22-23x FY27 EPS
- Waymo ~15-16% of rideshare gross bookings in SF/LA/Phoenix (YipitData, June 2026); ~22% inside its SF zone (Wolfe); ~500k paid trips/week in 10 US cities [T4 secondary research]
- Counter-evidence: Uber management states category share in LA/SF/Phoenix is HIGHER than a year ago, citywide and inside AV zones [Q2'26 call, T1]
- Tesla robotaxi: ~25 unsupervised vehicles in 3 Texas cities, prices ~$1.99/km; Reuters reports operational struggles; NVIDIA exec says Waymo leads Tesla [T2/T4]
- Uber AV strategy: >$10B committed (~$2.5B equity, ~$7.5B vehicle offtake), ~120k robotaxis targeted on platform, partners incl. Waymo, Nuro, Avride, WeRide, Momenta, Waabi, Wayve [T1 IR + Axios]
- Key risk flag: Reuters (citing FT, Sept 2026) — Waymo considering ending its Uber partnership; no termination announced [T2]
- Sell-side consensus PT ~$101-105, range $90-125, 41 buys / 8 holds / 1 sell [T4 aggregators]
- Reported ~10% workforce cut (~3,300 jobs) as resources shift to AV [T4 — needs primary confirmation]
Catalysts and risks
Catalysts
- Q3 2026 earnings (early Nov 2026): bookings growth, AV-partnership commentary, margin trajectory
- Resolution of Waymo-Uber partnership status — termination, renewal, or expansion terms
- Q4/FY26 report Feb 2, 2027: FY27 guidance vs the $4.54 consensus
- Tesla robotaxi city/fleet expansion announcements
- Deployed (not targeted) AV trip counts on Uber's platform — first hard proof of the aggregator thesis
- Any 2026 buyback authorization / formal capital-return framework announcement
Risks
- Waymo ends partnership and goes direct-to-consumer in more cities
- Tesla achieves scale with structurally lower prices, forcing mobility margin compression
- Driver classification rulings (e.g., Massachusetts class action) raise structural labor costs
- AV equity investments and $7.5B offtake commitments consume the FCF buffer and dilute
- Consumer/macro softness breaks the >20% cc bookings streak and removes the bull case's core support
- Consensus/share data rests heavily on T4 aggregators — targets and estimates could be misstated
What to watch
- Waymo-Uber partnership headlines (Reuters/FT) and any Uber IR statement
- Deployed AV fleet and completed AV trip counts on Uber's platform vs the 120k target
- Q3'26 gross bookings vs the $58.25-60.25B guidance, and non-GAAP EPS vs $0.84-0.88 guided
- Tesla unsupervised fleet count and city expansion from the ~25-vehicle base
- YipitData/Wolfe in-zone and citywide share data for SF/LA/Phoenix each quarter
- Any announced buyback size — would confirm FCF is being returned, not consumed by AV bets
- Driver classification litigation outcomes (Massachusetts and federal)
Market snapshot when the call was made 2026-10-16
Price
| Return 1w | -1.6% |
| Return 1m | -0.7% |
| Return 3m | -2.5% |
| Return 6m | -8.8% |
| Return 1y | -25.6% |
| From 52-week high | -29.4% |
| Realized vol, 20d | 24.7% |
| SPY 3m / 1y | +2.9% / +14.8% |
| QQQ 3m / 1y | +2.0% / +17.9% |
Technicals
UBER technicals as of 2026-10-16: last close $70.35; 20d SMA 69.67 (bearish); 50d SMA 73.10; 12d EMA 70.27; 26d EMA 70.72; RSI 14 58.1 (balanced); 20d vol 24.7%; volume x0.9 vs 20d avg
Next earnings: 2027-02-02 AMC
Verifier notes REVISE · opinion revised once
Unsupported claims
- Thesis: 'multiple expansion from ~16x forward EPS toward even 18-20x on FY27's $4.54 consensus implies 30%+ upside' — arithmetic overstates the upside. At the current price of $70.35, 18x $4.54 = $81.72 (+16%) and 20x $4.54 = $90.80 (+29%). The 18-20x range implies roughly 16-29% upside, not 30%+.
Corrections applied
- Restate the upside math as '~15-30% upside at 18-20x FY27 consensus EPS of $4.54' (or move the range to ~20-21x if '30%+' is to be retained: 21x $4.54 = $95.34, +35%). Note also that re-rating to 18-20x is a 12-month-plus scenario, which sits in mild tension with the stated 3-6 month horizon — worth clarifying that the re-rating is the endpoint, not the horizon.
Sources (38 · T1 = primary filings)
- T2https://www.reuters.com/commentary/breakingviews/london-will-wage-international-robotaxi-warfare-2026-06-24/
- T2https://www.reuters.com/company/lyft-inc/
- T4https://www.perplexity.ai/finance/LYFT
- T2https://www.reuters.com/markets/companies/LYFT.O/
- T4https://finance.yahoo.com/markets/stocks/articles/lyft-lost-25-value-last-124504829.html
- T4https://x.com/i/article/2106409445387329835
- T4https://rideobi.com/wp-content/uploads/2026/01/Obi_Tesla_Report_01.27.2026_digital-for-web.pdf
- T4https://sqmagazine.co.uk/robotaxi-statistics/
- T2https://www.reuters.com/company/waymo-llc/
- T2http://rmb.reuters.com/rmd/rss/item/tag:reuters.com,2026:newsml_MT1USDAYNETMI92142486007?channel=qru766
- T4https://www.investing.com/news/transcripts/earnings-call-transcript-uber-posts-mixed-q2-2026-results-as-stock-…
- T1https://investor.uber.com/news-events/news/press-release-details/2026/Uber-Announces-Results-for-Second-Quarte…
- T4https://www.tokenpost.com/news/business/34003
- T4https://www.thedailyupside.com/technology/artificial-intelligence/uber-waymo-and-tesla-accelerate-into-an-auto…
- T4https://uk.investing.com/news/transcripts/earnings-call-transcript-uber-posts-mixed-q2-2026-results-as-stock-f…
- T4https://markets.businessinsider.com/news/stocks/uber-stock-uber-why-guggenheim-is-bullish-despite-three-horse-…
- T1https://www.sec.gov/Archives/edgar/data/1543151/000154315126000027/uberq226earningspressrelea.htm
- T1https://www.sec.gov/Archives/edgar/data/1543151/000154315126000022/uber-20260331.htm
- T4https://www.marketbeat.com/instant-alerts/analyst-uber-technologies-uber-buy-rating-reiterated-at-guggenheim-2…
- T1https://www.sec.gov/Archives/edgar/data/1543151/000154315126000019/uberq126earningspressrelea.htm
- T4https://www.perplexity.ai/finance/UBER/analysis
- T4https://public.com/stocks/uber/forecast-price-target
- T4https://www.investing.com/equities/uber-technologies-inc-consensus-estimates
- T4https://www.cnn.com/markets/stocks/UBER
- T4https://www.androguider.com/2026/08/ubers-autonomous-vehicle-partnerships.html
- T4https://www.axios.com/2026/09/23/uber-robotaxi-av-strategy-dara-khosrowshahi
- T4https://www.linkedin.com/posts/michael-gaenzler_uber-is-building-an-autonomous-vehicle-empire-activity-7489360…
- T1https://investor.uber.com/news-events/news/press-release-details/2026/Uber-Unveils-Uber-Autonomous-Solutions-t…
- T4https://memeburn.com/every-uber-autonomous-vehicle-deal-in-2026/
- T4https://techcrunch.com/2026/02/23/uber-autonomous-solutions-av-robotaxi-delivery-robots/
- T4https://avmarketstrategist.substack.com/p/uber-q22026-10-billion-av-investment
- T4https://www.businessinsider.com/waymo-rideshare-market-uber-lyft-competition-impact-on-human-drivers-2026-8
- T4https://x.com/TheRideshareGuy/status/2110458655279550562
- T4https://letsdatascience.com/news/waymo-reaches-mid-teen-rideshare-share-but-driver-impact-rem-ae4d57e9
- T4https://www.wolferesearch.com/wp-content/uploads/2026/03/Uber-Lyft-Deep-Dive-Updated-AV-Market-Model-and-Share…
- T4https://legalclarity.org/uber-misclassification-settlement-amounts-by-state/
- T4https://www.smartcitiesdive.com/news/robotaxi-wars-uber-waymo-zoox-tesla/830930/
- T4https://finance.yahoo.com/markets/stocks/articles/uber-technologies-inc-uber-q2-190203049.html
Earlier and later calls on UBER
- Oct 6, 2026Derated, not deteriorating — lean bullish.Lean bullish
- Sep 1, 2026Yes — value is emerging here.Lean bullish
- Aug 9, 2026Not immediately; strategically, yes.Lean bullish
Want a fresh look at UBER, or another name?
Queue a new deep-research run. Published to the feed when done.
Automated research opinion, published as-is on Oct 18, 2026. Not personalised advice. Figures use end-of-day closes.