No edge until Oct 21.
Thesis
Bull case
Ad engine compounding >25% with both impressions (+19%) and pricing (+12%) positive; Q3 holds capex guidance and signals 2027 discipline; Muse/consumer AI converts sentiment into a monetization line; FCF trough passes, multiple sustains 22x+ on $34 FY27 EPS → WF's $1,000 scenario. Cleanest leveraged way to own AI-driven ad monetization at ~22x vs mega-cap peers.
Bear case
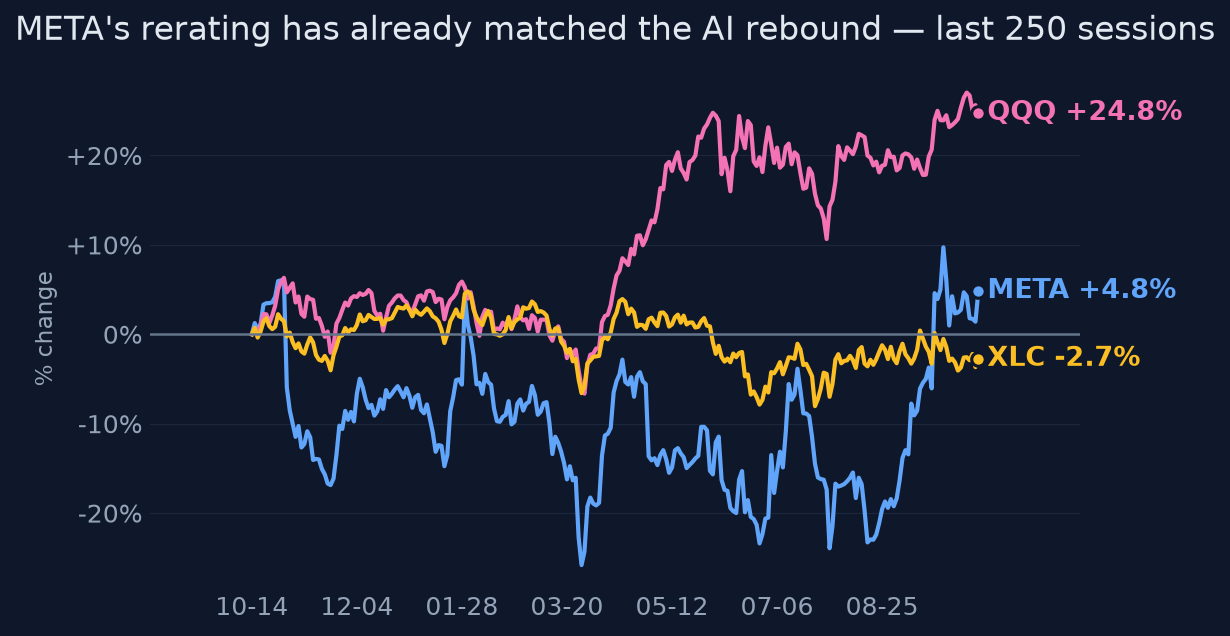
The re-rating already happened: PT consensus ~$791 is only ~4% up after a +15% month into an 84th-percentile-vol tape. EPS revisions are negative, Q3 guidance already disappointed once, 2027 opex consensus looks ~$10B too low per Wells Fargo, and off-balance-sheet Hyperion obligations plus $30B of new debt mean the capex bill is financed, not funded — any guidance raise re-opens the 17x multiple.
What would change our mind
- Bearish/neutral stance invalidated if Q3 holds capex at $130-145B AND guides 2027 opex at/below ~$205B with ad growth >20% — then the multiple case is validated
- Bull case invalidated if FY26 EPS consensus falls below ~$30 or capex guidance is raised above $145B while FCF stays under ~$15B/quarter
- If the stock de-rates below ~19x forward (~$640) with estimates intact, the asymmetry flips bullish and this view should be revisited
Since publication vs SPY · closed horizons are frozen
The full research everything the view rests on
Direct answer to the question asked
Where the edge would come from
What the price assumes
At ~$758 and ~22.5x forward, the price assumes Q3 revenue near $63B, capex guidance held (not raised) at $130-145B, continued 20%+ ad growth, and no negative 2027 cost surprise. The +14.7% one-month rally (z-score 1.22, 20d vol at 84th percentile) means a meaningful amount of good news is already in the tape.
Why the market may be wrong
Both directions are live. Upside: if Q3 shows capex peaking plus stable margins, the stock de-risks the 2027 opex fear and WF's $1,000 multiple-driven path opens. Downside: the Muse rally is [T4]-sourced sentiment, not confirmed monetization; if Q3 pairs another below-consensus guide with a capex raise or a 2027 opex hint toward $210B+, the stock retraces the re-rating with FCF already compressed (~$10-15B/quarter vs $30B+ OCF) and ~$57B of new explicit/economic debt layered on.
The one thing to watch
The variable to watch is not revenue or EPS — it's the gap between operating cash flow and capex: Meta's OCF (~$30B/qtr) is stable, but capex has consumed FCF down to ~$10-15B/qtr, and Meta has already shifted to financing the buildout with ~$30B corporate debt plus ~$27B off-balance-sheet Hyperion JV obligations that are economically fixed commitments. The stock will re-rate on the first quarter where guidance implies the FCF trough is behind, not on ad growth beats.
Key evidence (10)
- Q2'26 (Jul 29): revenue $60.8B +28% YoY beat; adj EPS $6.18 vs $7.17 est; $2.4B legal + $1.2B severance; expenses +55% YoY; operating margin 31% [T1]
- FY26 capex guidance $130-145B (narrowed, not raised) vs FY25 operating income of $83B [T1/SEC]
- Q2'26 ad impressions +19%, average ad price +12%; Reality Labs operating loss -$4.62B [T1]
- FY26 EPS consensus cut $32.91→$31.07 (-5.6%) over 3 months; FY27 cut $34.96→$34.02 [T3/T4]
- Forward P/E ~22.3-22.6x now vs ~17x at 2026 low [T4]
- ~$30B corporate bond offering (Oct 2025); ~$27B Hyperion JV debt with Blue Owl, Meta ~20% owner, 20-yr lease [T2 Reuters/Bloomberg]
- Q3'25 FCF $10.6B on $30B OCF; Q2'26 FCF ~$15B (estimate, treat cautiously) [SEC/T4]
- Q3'26 earnings Oct 21, 2026 AMC [T1 Meta IR]; Street revenue ~$63.2B
- Wells Fargo $1,000/Overweight but models EPS $31-32 below consensus and 2027 opex $210-215B vs Street ~$202B [T4]
- 1y return +1.3% vs QQQ +22.2%, GOOGL +46.0%; max drawdown -30.1%; idiosyncratic share 94-100% [computed price data]
Catalysts and risks
Catalysts
- Q3'26 earnings Oct 21, 2026 AMC — capex guide and 2027 opex framework are the swing factors
- Any 2027 capex/opex commentary (Street ~$202B opex vs WF $210-215B)
- Muse monetization metrics (pricing, engagement, revenue attribution)
- EU DMA / US antitrust remedy developments
- FY26 Q4 print Jan 26, 2027 with first formal 2027 guidance
Risks
- Capex guidance raised above $145B or 2027 framework implies further FCF compression
- Ad growth decelerates below ~20% while costs stay elevated
- Muse thesis proves sentiment-only ([T4]-sourced traction claims unconfirmed)
- Regulatory/legal charges recur (Q2 already had $2.4B)
- Off-balance-sheet financing obligations re-priced by credit markets
- High realized vol (52.6% 20d) amplifies a post-earnings drawdown
What to watch
- Q3 capex guidance: hold vs raise — the single biggest variable
- Any quantified AI attribution to ad revenue from management
- FCF trajectory (OCF minus capex) vs the ~$10-15B/qtr recent range
- 2027 opex consensus migration toward or away from WF's $210-215B
- Reality Labs loss run-rate vs Q2's -$4.62B
- Ad impression/price split (was +19%/+12% in Q2)
Market snapshot when the call was made 2026-10-12
Price
| Return 1w | +0.1% |
| Return 1m | +14.7% |
| Return 3m | +12.4% |
| Return 6m | +17.1% |
| Return 1y | +1.3% |
| From 52-week high | -4.5% |
| Realized vol, 20d | 52.6% |
| SPY 3m / 1y | +3.5% / +15.9% |
| QQQ 3m / 1y | +3.7% / +22.2% |
Technicals
META technicals as of 2026-10-12: last close $742.96; 20d SMA 723.05 (bullish); 50d SMA 643.46; 12d EMA 725.81; 26d EMA 700.84; RSI 14 51.6 (balanced); 20d vol 54.1%; volume x1.1 vs 20d avg
Next earnings: 2027-01-26 AMC
Sources (28 · T1 = primary filings)
- T4https://www.perplexity.ai/finance/META?comparing=META,AAPL,AMZN,TSLA,MNST
- T4https://admiralmarkets.com/education/articles/shares/meta-stock-analysis-october-2026
- T4https://www.perplexity.ai/finance/META?comparing=META,MSFT,AAPL,TSLA,TAL
- T4https://www.perplexity.ai/finance/META?comparing=META,SOPA,BMR,SLE,BNZI,SNAP
- T4https://www.perplexity.ai/finance/META?comparing=META,RBRK,NVDA,AAPL,TSLA
- T4https://www.perplexity.ai/finance/META?comparing
- T4https://drillr.ai/article/meta-q3-2026-earnings-preview-ad-pricing-ai-capex
- T4https://www.perplexity.ai/finance/META?comparing=META,NVDA,MSFT,PNC,AMZN
- T1https://investor.atmeta.com/investor-news/press-release-details/2026/Meta-to-Announce-Third-Quarter-2026-Resul…
- T4https://www.perplexity.ai/finance/META?comparing=META,NOW,CRM,INTU,CSCO,AAPL
- T4https://www.perplexity.ai/finance/META?comparing=META,MSFT,GOOG,AAPL,IEP
- T4https://finance.yahoo.com/markets/stocks/articles/meta-platforms-stock-soared-27-110500007.html
- T4https://www.perplexity.ai/finance/META?comparing=META,AAPL,AMZN,NVDA,WDAY
- T2https://www.reuters.com/legal/transactional/meta-set-clinch-nearly-30-billion-financing-deal-louisiana-data-ce…
- T4https://last10k.com/sec-filings/meta/0001628280-25-047240.htm
- T2https://www.reuters.com/business/meta-seeks-least-25-billion-bond-offering-bloomberg-reports-2025-10-30/
- T2https://www.reuters.com/commentary/reuters-open-interest/are-ai-credit-cracks-warning-or-buy-signal-2026-09-29…
- T2https://www.bloomberg.com/news/articles/2025-09-05/meta-s-backstop-is-linchpin-for-26-billion-ai-data-center-d…
- T4https://www.metatrader.com/en/symbols/nasdaq/meta/documents/1382241-quarterly-report-q2-fy2026
- T4https://economictimes.com/tech/artificial-intelligence/metas-backstop-is-linchpin-for-26-billion-ai-data-cente…
- T4https://www.stocktitan.net/financials/META/free-cash-flow/
- T4https://finance.yahoo.com/markets/stocks/articles/meta-gets-1-000-target-151236825.html
- T4https://www.marketbeat.com/instant-alerts/analyst-meta-platforms-nasdaq-meta-given-buy-rating-at-td-cowen-2026…
- T4https://www.perplexity.ai/finance/META
- T4https://finance.yahoo.com/markets/stocks/articles/wells-fargo-hands-meta-1-025902149.html
- T4https://www.marketbeat.com/instant-alerts/consensus-meta-platforms-inc-nasdaq-meta-receives-consensus-rating-o…
- T4https://www.pricetargets.com/NASDAQ/META/
- T4https://www.marketbeat.com/stocks/NASDAQ/META/earnings/
Earlier and later calls on META
- Oct 19, 2026Capex, not revenue, decides.No clear edge
- Oct 4, 2026No — the rally outran the evidence.Lean bearishview changed
- Aug 17, 2026Buy, but small and patient.Lean bullishview changed
Want a fresh look at META, or another name?
Queue a new deep-research run. Published to the feed when done.
Automated research opinion, published as-is on Oct 13, 2026. Not personalised advice. Figures use end-of-day closes.