Capex, not revenue, decides.
Thesis
Bull case
The market has pre-paid the pain: 30% drawdown, flat 1-year return, multiple below historical range, while the core ad business is arguably the strongest it's ever been (price AND volume both up double digits). If Meta merely holds capex/expense guides and shows operating income tracking above 2025, the de-rating unwinds — 18–25% upside to street targets, with implied move (±6%) possibly underpricing realized event risk (avg 9.6%).
Bear case
Consensus at the top of the guide plus a high whisper bar means in-line is a miss. Any raise to capex/expense guidance, deceleration in ad-price growth from +12%, or FY27 commentary implying no FCF recovery confirms the structural-bear view: Meta is converting a 41% operating-margin business into a lower-return infrastructure utility, and the current multiple discount is fair, not excessive. Net-negative 2026 EPS revisions suggest the street is already drifting this way.
What would change our mind
- For the bullish re-rating case: capex or expense guidance raised again, or operating income tracking below the 'above 2025' commitment — that confirms structural FCF impairment
- For the bearish case: revenue above ~$63.5B with guides held flat and quantified AI monetization — that breaks the 'spending without returns' narrative
- If FY27 EPS estimates ($33.92) hold or rise while the stock stays below ~$700 post-print, the drawdown was multiple compression, not deterioration
Since publication vs SPY · closed horizons are frozen
The full research everything the view rests on
Direct answer to the question asked
Where the edge would come from
What the price assumes
Consensus Q3 2026: revenue ~$63.2–63.3B (top of the $61–64B guide), adjusted EPS ~$6.58–6.85, Reality Labs loss ~$5.7B. Options imply ±6% (~$42), below the ~9.6% historical average realized move — the options market may be underpricing event risk given 99th-percentile realized vol (56% annualized). Sell-side stays bullish (targets ~$831–878, 18–25% upside) while the market has de-rated the stock, pricing execution/capex risk the analysts aren't.
Why the market may be wrong
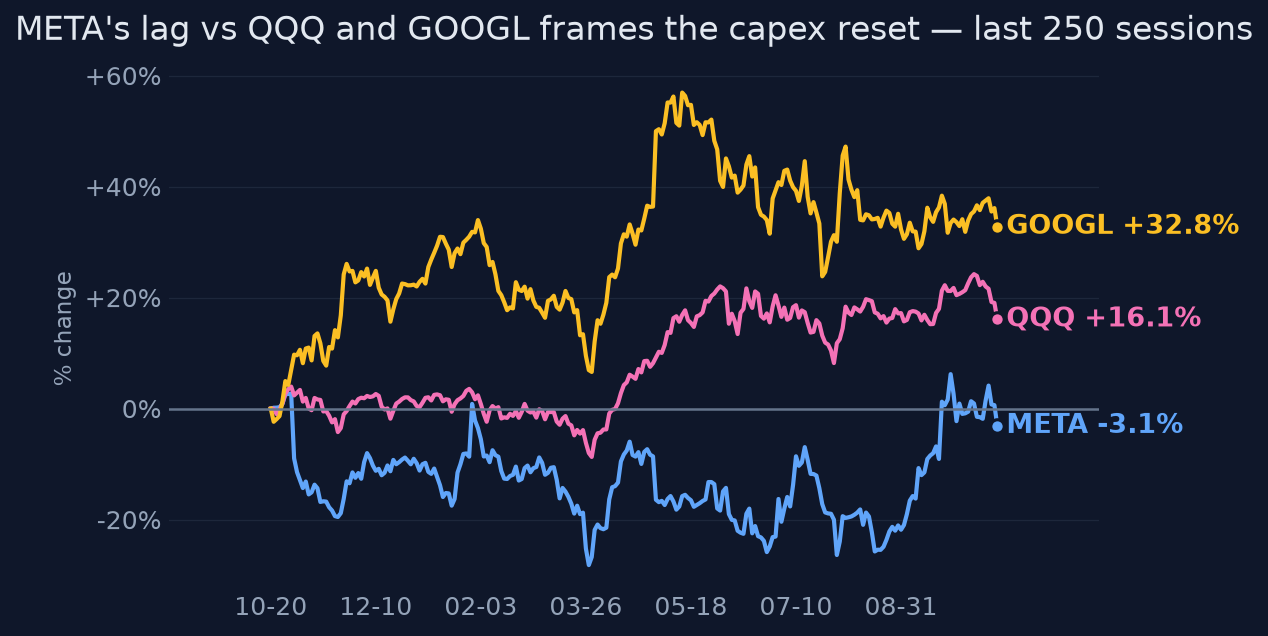
Two-sided. Bearish case: consensus at the top of the guide plus net-negative 2026 EPS revisions (4 up vs 6 down in 30 days) means the whisper bar is high and an in-line print disappoints; the de-rating may be the market correctly pricing structurally lower FCF. Bullish case: the de-rating is overdone — forward P/E sits 6–22% below its historical range while revenue grows 28% y/y with both impressions (+14%) and price (+12%) rising, and Advantage+ alone is >$75B annualized; any credible capex-returns evidence could trigger a sharp re-rating, especially with the stock flat over a year while QQQ +18%.
The one thing to watch
Stop watching the revenue line: META is 93–97% idiosyncratic vs. SPY/QQQ/GOOGL/AMZN (correlations 0.2–0.3), meaning the stock trades almost purely on the capex-to-FCF conversion question — the single variable that matters is whether the FY26 capex guide ($130–145B) and expense guide ($165–169B) are held or raised, because that's what determines whether the ~6–22% forward P/E discount to its own history closes or widens.
Key evidence (8)
- Q2 2026 (reported July 29, 2026): revenue $60.8B (+28% y/y, beat by ~$514M) but EPS $6.18 missed on a $2.4B legal charge [T1 Meta IR]
- FY26 guides: capex $130–145B (nearly 2x prior year), expenses $165–169B, tax rate raised to 15–17%, operating income 'above 2025' [T1]
- Q3 consensus ~$63.2–63.3B revenue (top of $61–64B guide), adjusted EPS $6.58–6.85, Reality Labs Q3 loss ~$5.7B [T3 S&P Global/Visible Alpha]
- Ad engine strong: +14% impressions, +12% average ad price in Q2; Advantage+ >$75B annualized [T1/T4]
- Stock flat over 1 year (-1.2%) vs QQQ +17.9% and GOOGL +35.7%; -30% max drawdown; 93–97% idiosyncratic vs peers/benchmarks [computed from price history]
- Forward P/E ~21.5–22x vs cited 23.7–27.6x historical forward range [T4 chartloom — multiple-source caveat]
- Estimate revisions net negative for 2026 EPS (4 up/6 down in 30 days), net positive for 2027 (7 up/3 down) [T4 Yahoo aggregation]
- Options imply ±6% move vs ~9.6% historical average realized move; 20d realized vol 56% annualized at 99th percentile [T4 aggregators + computed vol]
Catalysts and risks
Catalysts
- Q3 2026 earnings Oct 21, 2026 after close (call 4:30pm ET) — capex/expense guide language is the key variable
- Q4 2026 revenue guidance issued on the same call
- Any FY27 capex preliminary commentary
- Alphabet/Amazon Q3 ad prints as read-throughs on ad-market health
- EU DMA / antitrust developments (not surfaced in research but a standing tail risk)
Risks
- Capex guide raised above $145B or expense guide above $169B without offsetting revenue evidence
- Ad-price growth decelerates materially from +12% as comps toughen
- Reality Labs losses (~$5.7B/qtr) persist with no path shown
- Estimate-quality risk: unusually wide consensus dispersion (revenue $55.9B–63.3B; EPS $5.60–6.85) means 'beat/miss' headlines may be unreliable
- Legal/regulatory charges recurring after Q2's $2.4B hit
What to watch
- FY26 capex guide: held at $130–145B vs raised — the single most important line
- Q4 revenue guidance vs whatever consensus emerges
- Operating margin / operating income vs the 'above 2025' commitment
- Ad price growth: hold near +12% or decelerate
- Management quantification of AI revenue contribution (Advantage+ scale, Meta AI monetization)
- FY27 capex color and 2027 EPS estimate revisions in the days after the print
Market snapshot when the call was made 2026-10-16
Price
| Return 1w | -1.3% |
| Return 1m | +4.0% |
| Return 3m | +9.8% |
| Return 6m | +3.0% |
| Return 1y | -1.1% |
| From 52-week high | -8.8% |
| Realized vol, 20d | 56% |
| SPY 3m / 1y | +2.9% / +14.8% |
| QQQ 3m / 1y | +2.0% / +17.9% |
Technicals
META technicals as of 2026-10-16: last close $709.33; 20d SMA 735.77 (bullish); 50d SMA 655.24; 12d EMA 729.41; 26d EMA 709.94; RSI 14 48.2 (balanced); 20d vol 40.1%; volume x0.9 vs 20d avg
Sources (20 · T1 = primary filings)
- T1https://investor.atmeta.com/investor-news/press-release-details/2026/Meta-to-Announce-Third-Quarter-2026-Resul…
- T1https://investor.atmeta.com/investor-news/default.aspx
- T4https://www.marketbeat.com/earnings/reports/2026-10-21-facebook-inc-stock/
- T1https://investor.atmeta.com/search-results/default.aspx?SearchTerm=&PageNumber=236
- T3https://www.spglobal.com/market-intelligence/en/news-insights/research/2026/10/meta-and-netflix-earnings-previ…
- T4https://drillr.ai/article/meta-q3-2026-earnings-preview-ad-pricing-ai-capex
- T4https://pepperstone.com/en/insights/market-analysis/equities/q3-2026-earnings-preview-can-ai-deliver-the-next-…
- T4https://www.marketbeat.com/earnings/reports/2026-10-28-facebook-inc-stock/
- T1https://investor.atmeta.com/investor-events/
- T4https://www.stocktitan.net/news/META/meta-to-announce-third-quarter-2026-xthjv1vpcuwo.html
- T4https://ca.finance.yahoo.com/quote/META/press-releases/
- T4https://moneycheck.com/meta-stock-what-wall-street-expects-from-earnings-wednesday/
- T4https://coinpaper.com/37495/meta-faces-145b-ai-spending-test-as-wall-street-prices-6-stock-swing-ahead-of-octo…
- T4https://uk.finance.yahoo.com/quote/META/news/
- T4https://www.perplexity.ai/app/finance/META/earnings?comparing=META,HYG,EEMV,VFTAX,EWJ,XLB,IWP,IUSV,EUFN,ESGU,E…
- T4https://www.moomoo.com/news/post/1001423547/earnings-preview-meta-faces-its-ai-monetization-test-can-the
- T4https://www.ig.com/uk/news-and-trade-ideas/meta-q3-results-preview--can-ai-spending-deliver-advertising-gro-26…
- T4https://www.theglobeandmail.com/investing/markets/stocks/AMZN/pressreleases/8190197/should-you-buy-sell-or-hol…
- T4https://news.alphastreet.com/meta-platforms-q3-2026-earnings-preview-october-21-street-expects-5-94-eps/
- T4https://www.perplexity.ai/finance/META/earnings
Earlier and later calls on META
- Oct 13, 2026No edge until Oct 21.No clear edge
- Oct 4, 2026No — the rally outran the evidence.Lean bearishview changed
- Aug 17, 2026Buy, but small and patient.Lean bullishview changed
Want a fresh look at META, or another name?
Queue a new deep-research run. Published to the feed when done.
Automated research opinion, published as-is on Oct 19, 2026. Not personalised advice. Figures use end-of-day closes.