Yes — derated, not broken.
Thesis
Bull case
At 19-20x forward EPS with a 4.3% FCF yield, the market prices Netflix like a no-growth asset while the company still guides to ~13% revenue growth and 31.5% margins. A buyback running at the Q2 pace (~6% of market cap annualized) executed at depressed prices drives mid-to-high-teens EPS growth mechanically. Ads reaching ~$3B in FY26 and scaling toward a double-digit revenue share, plus pricing power (recent increases progressing well per management), restore the second-engine narrative. The WBD exit removes the overhang, returns capital, and the Q3 print (Oct 20) against a below-consensus guide of $12.86B is a low bar — a beat re-rates the stock toward ~$90-97 (25-27x FY26 EPS of $3.59).
Bear case
Management has guided below consensus twice in a row and is simultaneously shrinking disclosure (no subscriber counts, annual-only viewing hours) — behavior consistent with insiders seeing a slower growth glide path. US TV share fell a full point YoY while YouTube gained; the ad tier is ramping slower than hoped; mature-market saturation plus reduced pricing headroom could push FY27 growth toward high single digits, at which point 20x is fair, not cheap, and one analyst already trimmed FY27 EPS. Hastings' exit and a failed empire-building bid mark a transition to ex-growth stewardship; multiple compression to 15x on $3.59 EPS implies ~$54 (-23%).
What would change our mind
- Q3 revenue misses the $12.86B guide AND Q4/FY27 guidance implies high-single-digit growth
- FY26 consensus EPS of ~$3.59 is revised materially lower (below ~$3.40) — then 20x is not cheap
- Buyback pace falls well below $4B/quarter despite the depressed price, signaling management doesn't view the stock as undervalued
- Management cuts the FY26 ad-revenue target or lowers the 31.5% operating-margin target
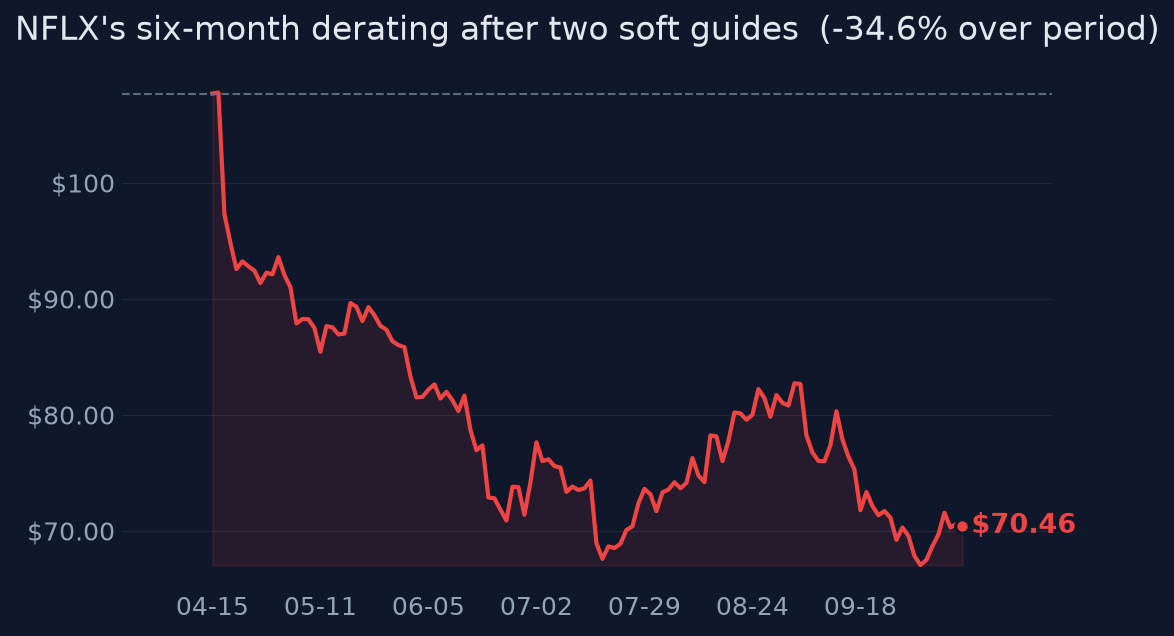
Since publication vs SPY · closed horizons are frozen
The full research everything the view rests on
Direct answer to the question asked
Where the edge would come from
What the price assumes
At $70.46 (~19-20x FY26 consensus EPS of $3.59), the price appears to assume growth decelerates toward single digits and that the ad tier fails to become a meaningful second engine. The market is pricing Netflix as an ex-growth media asset rather than a 12-13% grower with expanding margins — roughly in line with where mature entertainment peers trade, despite Netflix's superior margin trajectory (20.6% → 29.5% operating margin 2023–2025) and $12.5B FCF.
Why the market may be wrong
Two below-consensus guides were interpreted as a broken growth algorithm, but the absolute numbers still imply ~13% FX-adjusted growth and ~$6B of incremental revenue in FY26. The WBD exit removed the biggest overhang and netted a ~$2.8B termination fee, demonstrating capital discipline rather than desperation. Bears extrapolate Nielsen US TV-share decline (7.8% vs 8.8% YoY) into a global engagement collapse, but share-of-US-TV is not absolute hours, excludes mobile/international, and Netflix's monetization is pricing- and ads-driven, not viewing-share-driven. Meanwhile the buyback at current depressed prices is accretive in a way the market rarely credits until EPS prints show it.
The one thing to watch
The variable to watch is not subscriber growth or even ad revenue — it's the buyback-to-market-cap ratio: at the record Q2 pace ($4.7B/quarter ≈ ~6% of the $293B cap annualized), with remaining authorization equal to ~9% of market cap, Netflix is mechanically shrinking the share count at a 20x multiple, which means EPS can grow mid-to-high teens even if revenue growth slips to low double digits; the debate about 'growth' is happening on the wrong line of the income statement.
Key evidence (10)
- FY26 revenue guidance narrowed to $51.0-51.4B (~13-14% growth) on Oct 13, 2026, with 31.5% operating-margin target maintained [T1/T4, Oct 2026]
- FY26 consensus ~$51.23B revenue / $3.59 EPS and forward P/E ~19-20x as of Oct 14, 2026 — note these rest on T4 sources (Zacks/market data), not verified T1/T2 [T4, Oct 2026]
- Q2 2026: revenue $12.56B (+13.4% YoY, slight miss), adj EPS $0.80 (slight beat), OM 33.4%; Q3 guide of $12.86B/$0.82 was below consensus and drove a ~10% selloff [T2 Reuters, Jul 2026]
- Operating margin trajectory: 20.6% (2023) → 26.7% (2024) → 29.5% (2025) [T1 SEC XBRL]
- Netflix walked away from the WBD bid (originally ~$82.7B EV) rather than match Paramount Skydance, collecting a ~$2.8B termination fee; no acquisition debt drawn [T1 SEC]
- 2026 FCF guidance raised to ~$12.5B; record $4.7B buyback in Q2 2026; +$25B authorization added April 2026, ~$27.1B remaining [T1 IR]
- Nielsen Gauge July 2026: Netflix 7.8% of US TV viewing vs 8.8% a year earlier; YouTube 14.2% vs 13.4% [T3 Nielsen]
- Decline is ~98-100% idiosyncratic (60d correlation to SPY 0.15; SPY +12% over same 6 months); the -94% 1y return in raw data is a Nov 2025 10:1 split artifact — real 6m decline ~-34%
- Netflix stopped reporting subscriber counts and will cut viewing-hours disclosure to annual from 2027 [T2]
- FY26 ad revenue target of ~$3B reiterated; Street views the ramp as slower than hoped [T2/T4]
Catalysts and risks
Catalysts
- Q3 2026 earnings Oct 20, 2026 — revenue vs $12.86B guide, OM vs 33.2%, ad-revenue update, Q4/FY27 framing
- Any FY27 guidance or commentary on ad-tier trajectory and engagement disclosure
- Buyback pace disclosure in Q3/Q4 prints (record $4.7B in Q2 sets the bar)
- Nielsen Gauge monthly releases — stabilization vs continued US TV-share decline
- Potential further capital-return actions given ~$27.1B remaining authorization
Risks
- A third consecutive soft guide on Oct 20 would confirm deceleration and likely break the ~$70 level
- Ad revenue disappoints vs the ~$3B FY26 target, undermining the second-engine thesis
- Reduced disclosure (subscriber counts gone, viewing hours annual from 2027) keeps a governance/transparency discount on the multiple
- Engagement share losses to YouTube accelerate and eventually hit pricing power and churn
- Key factual pillars (consensus EPS $3.59, forward P/E ~20x, guidance figures) rest partly on T4 sources (Zacks/Yahoo) rather than fully verified T1/T2
- No verifiable historical forward-P/E range is available in the evidence, so claims about how 'rare' the current multiple is cannot be substantiated
What to watch
- Oct 20 Q3 print: revenue vs $12.86B, EPS vs ~$0.82-0.83 consensus, Q4 guide direction
- Q3 buyback dollar amount and remaining authorization — whether the ~6%-of-cap annualized pace holds
- Ad-revenue commentary: pace vs the ~$3B FY26 target and any FY27 ad ambitions
- Monthly Nielsen Gauge: whether Netflix's ~7.8% US TV share stabilizes
- FY27 consensus EPS revisions (currently ~$3.79-3.82 in isolated prints) — breadth of cuts matters more than level
Market snapshot when the call was made 2026-10-13
Price
| Return 1w | +2.6% |
| Return 1m | -12.3% |
| Return 3m | -4.4% |
| Return 6m | -33.7% |
| Return 1y | -94.2% |
| From 52-week high | -94.3% |
| Realized vol, 20d | 30% |
| SPY 3m / 1y | +3.1% / +19.1% |
| QQQ 3m / 1y | +3.6% / +26.1% |
Technicals
NFLX technicals as of 2026-10-13: last close $70.46; 20d SMA 70.81 (bearish); 50d SMA 75.25; 12d EMA 70.37; 26d EMA 71.98; RSI 14 46.6 (balanced); 20d vol 29.3%; volume x0.7 vs 20d avg
Verifier notes REVISE · opinion revised once
Unsupported claims
- 'trading at a rare valuation dislocation (lowest forward multiple in years)' — the evidence bundle explicitly states the available results do NOT provide a verifiable historical forward-P/E range or percentile comparison, so 'lowest in years' cannot be asserted as fact. It should be softened to 'a forward multiple well below levels associated with its prior growth premium' or attributed to a source.
Weakly sourced
- The '~6-9% annualized share-count reduction' in most_differentiated_insight: annualizing the record Q2 pace ($4.7B x 4 = $18.8B / $293B cap) yields ~6.4%; the 9% figure is the total remaining authorization as a share of market cap, not an annualized pace. The upper bound is not supported by any evidence on expected run-rate and should be capped at ~6-6.5% or framed as 'authorization equals ~9% of market cap'.
- FY26 consensus revenue/EPS and forward P/E rest on T4 sources (Zacks/market data) — the opinion does flag this in risks, which is appropriate, but key_evidence items presented as fact ('FY26 consensus: ~$51.23B revenue, $3.59 EPS') carry only [T4] support.
Corrections applied
- In why_this_matters, replace '(lowest forward multiple in years)' with '(~19-20x forward, a steep derating from its prior growth premium)' or attribute a historical comparison to a specific source; the evidence bundle expressly says no historical forward-P/E range could be verified.
- In most_differentiated_insight, revise '~6-9% annualized share-count reduction' to '~6% annualized at the Q2 pace, with ~9% of market cap in remaining authorization' — the 9% is authorization/cap, not a demonstrated annual pace.
- Minor: bull_case's 're-rates toward $85-95 (25-27x FY26 EPS)' is arithmetically loose — 25-27x $3.59 implies ~$90-97; either adjust the multiple range to ~24-26x or the price range to ~$90-97.
Sources (32 · T1 = primary filings)
- T1https://www.sec.gov/Archives/edgar/data/1065280/000106528025000407/ex991_q425stocksplit.htm
- T1https://www.sec.gov/Archives/edgar/data/1065280/000106528025000407/nflx-20251030.htm
- T1https://www.sec.gov/Archives/edgar/data/1065280/000106528025000450/nflx-20251114.htm
- T1https://ir.netflix.net/investor-news-and-events/financial-releases/2025/Netflix-Announces-Ten-For-One-Stock-Sp…
- T2https://www.reuters.com/business/media-telecom/netflix-third-quarter-earnings-forecast-falls-shy-wall-street-e…
- T2https://www.reuters.com/business/media-telecom/lacks-excitement-netflix-tumbles-9-weak-earnings-forecast-deepe…
- T2https://www.reuters.com/business/netflix-shares-fall-after-downbeat-revenue-forecast-co-founder-leave-2026-04-…
- T1https://ir.netflix.net/investor-news-and-events/financial-releases/2025/default.aspx
- T1https://www.sec.gov/Archives/edgar/data/1437107/000119312526005423/d76022d425.htm
- T1https://www.sec.gov/Archives/edgar/data/1437107/000119312526015959/d304272dprem14a.htm
- T4https://www.ibc.org/ott-streaming/news/netflix-founder-reed-hastings-to-step-down/22794
- T4https://www.bbc.com/news/articles/cvglzn9e82eo
- T1https://www.sec.gov/Archives/edgar/data/1437107/000119312526055653/d113739ddfan14a.htm
- T1https://www.sec.gov/Archives/edgar/data/1437107/000119312526053012/d97951ddefa14a.htm
- T4https://www.marketing-interactive.com/netflix-chairman-to-step-down-as-streamer-posts-strong-q1-results
- T1https://www.sec.gov/Archives/edgar/data/1437107/000119312526005429/d75660d425.htm
- T4https://www.nielsen.com/news-center/2026/tv-usage-kicks-usual-summer-slowdown-fueled-by-world-cup-and-streamin…
- T4https://www.nielsen.com/news-center/2026/streaming-embarks-on-annual-summer-ascent-in-nielsens-may-2026-gauge-…
- T4https://www.nielsen.com/news-center/2026/broadcasters-and-pay-channels-show-dominance-in-south-koreas-tv-viewi…
- T4https://www.nielsen.com/data-center/the-gauge/
- T4https://finance.yahoo.com/markets/stocks/articles/youtubes-lead-over-netflix-tv-235802914.html
- T4https://www.mediapost.com/publications/article/416087/nielsen-youtube-gains-fox-roku-would-be-third.html
- T4https://www.mediapost.com/publications/article/417308/streaming-climbs-to-485-viewing-share-but-new.html
- T4https://www.thewrap.com/media-platforms/streaming/youtube-viewership-july-2026/
- T1https://ir.netflix.net/ir-overview/top-investor-questions/default.aspx
- T4https://finance.yahoo.com/markets/stocks/articles/paramount-paid-netflix-2-8-230000125.html
- T4https://www.zacks.com/stock/news/2955750/netflix-q2-earnings-beat-stock-falls-on-revenue-miss-lower-outlook
- T4https://fsm.global/sg/article/rcms357060/netflix-lost-the-warner-bid-but-still-emerged-a-winner
- T4https://www.ig.com/uk/news-and-trade-ideas/netflix-q3-results-preview-can-advertising-deliver-the-next-phas-26…
- T4https://static.poder360.com.br/uploads/2026/07/Netflix-2T2026.pdf
- T4https://www.marketbeat.com/instant-alerts/upcoming-netflix-nflx-set-to-release-quarterly-earnings-on-tuesday-2…
- T4https://www.newser.com/aticles-market/Warner-Bros-Discovery-Inc-WBD-Scrapped-Acquisition-Precedes-Netflixs-25-…
Earlier and later calls on NFLX
- Oct 16, 2026De-rating overdone, but catalyst-gated.Lean bullish
- Oct 10, 2026Fairly valued after the reset.Neutralview changed
- Oct 7, 2026Lean bullish — a reset, not a break.Lean bullish
- Oct 7, 2026Lean bullish into Oct 20.Lean bullish
Want a fresh look at NFLX, or another name?
Queue a new deep-research run. Published to the feed when done.
Automated research opinion, published as-is on Oct 14, 2026. Not personalised advice. Figures use end-of-day closes.