De-rating overdone, but catalyst-gated.
Thesis
Bull case
FY26 guide is achievable (13-14% growth, 31.5% margin), ad revenue doubles to ~$3B and inflects in 2027, the $25B buyback plus $2.8B fee plus $12.5B FCF retires 3-5% of shares annually, and the multiple re-rates from 20x toward 25-28x as the WBD overhang and growth panic fade — implying $90-100+ within 6-12 months, in line with every cited analyst target. Q3 needs only an in-line print plus ad momentum and buyback disclosure to start that move.
Bear case
Engagement decline is structural: viewing per subscriber is falling, YouTube and a newly merged Paramount+WBD/HBO ('Skydance') are taking share, content spend is rising ~10% while the slate underdelivers, and ad revenue keeps missing (Q2: -7.2% vs consensus). If 2027 growth slides to high single digits, FY27 EPS estimates (~$3.59-3.79) compress and 20x is no floor — the stock is a melting ice cube priced as merely 'cheap', and reduced engagement disclosure (annual from 2027) removes the very data that would refute it.
What would change our mind
- Q3 revenue below ~$12.8B with ad revenue below ~$780M and no acceleration language — confirms the miss is a trend, not a blip
- FY26 guidance cut below $51.0B or op margin guide below 31.5% on Oct 20
- Buyback disclosure showing minimal repurchases under the $25B authorization — removes the capital-return floor
- FY27 EPS consensus falling below ~$3.40 post-print while the stock holds ~20x — meaning the de-rating was estimate-driven, not sentiment-driven, with more downside to come
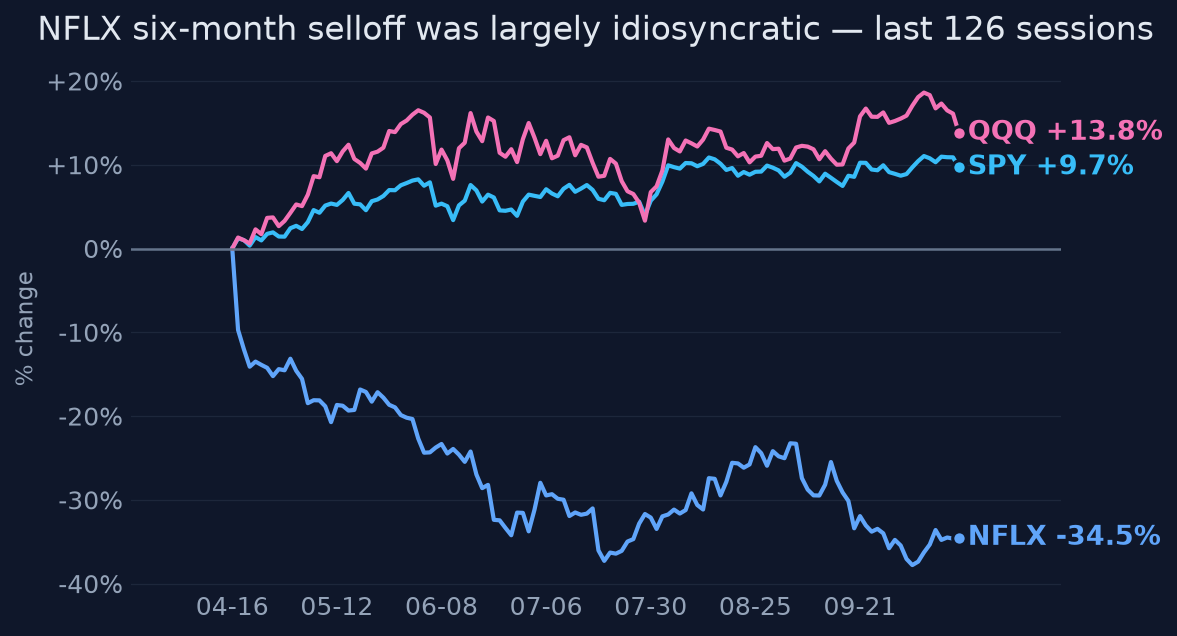
Since publication vs SPY · closed horizons are frozen
The full research everything the view rests on
Direct answer to the question asked
Where the edge would come from
What the price assumes
At ~$72.61 (~20x consensus FY26 EPS of ~$3.58, ~4% FCF yield, $302B market cap), the market prices low-double-digit growth as the permanent new normal, assigns no credit for ad-tier acceleration or buyback-driven EPS, and sits below every cited analyst target ($80-$100). Consensus for Q3 (~$12.87-12.88B revenue, $0.82 EPS) is essentially at guidance, so expectations for the print itself are low.
Why the market may be wrong
The market may be extrapolating soft H1 engagement (Wells Fargo's ~8% viewing-per-subscriber decline, top-100 originals weakness) into structural decline while ignoring: ad revenue doubling to ~$3B in 2026 off a small base, 33%+ operating margins already being delivered (Q2: 33.4%), and a step-change in capital returns. A ~98% idiosyncratic, -44pt six-month spread vs SPY suggests capitulation-style repricing rather than measured estimate revision — revisions are only modestly negative (-0.7% on Q3 EPS over 30 days), far milder than the price action implies.
The one thing to watch
The variable that matters now is not subscriber growth or even ad revenue — it is disclosed buyback pace under the new $25B authorization. The equity story has quietly shifted from 'premium growth compounder' to 'double-digit grower retiring ~3%+ of its float annually with a $2.8B windfall'; at 20x forward, every point of confirmed repurchase pace is worth more to the multiple than a Q3 revenue beat, and the Oct 20 call is the first chance for management to quantify it.
Key evidence (8)
- 10-for-1 split Nov 14, 2025 [T1 SEC] — headline -94% 1y price return is an unadjusted artifact; real 6m return -34.5%
- FY25 revenue $45.2B (+16%), op margin 29.5%; FY26 guided $51.0-51.4B (+13-14%), 31.5% op margin, ~$12.5B FCF [company guidance via earnings research]
- Q2 2026: revenue $12.56B missed consensus; ad revenue ~$618M was 7.2% below consensus [T3 S&P Global]; op margin 33.4%; EPS $0.80 beat
- WBD deal terminated Feb 26, 2026; Netflix received $2.8B termination fee; Paramount closed ~$110B WBD acquisition Oct 6, 2026 [T2 Reuters]
- Reported additional $25B buyback authorization after WBD withdrawal [research; pace unconfirmed — flagged gap]
- Wells Fargo: ~8% decline in viewing time per subscriber per day, H1 2026 vs 2023 [T3]; engagement reporting cut to annual from 2027
- Q3 2026 earnings Oct 20; consensus ~$12.87-12.88B / $0.82 EPS, essentially at guidance; Q3 EPS revised down 0.7% over 30 days
- Selloff ~98% idiosyncratic: 60d correlation to SPY/QQQ ~0.1; 6m spread vs SPY -44pts [quant analysis]
Catalysts and risks
Catalysts
- Q3 2026 earnings Oct 20, 2026 — revenue vs ~$12.87B consensus, ad revenue vs ~$806M expectation, Q4 guide, first 2027 commentary
- Disclosed buyback pace under the $25B authorization (10-Q / earnings call)
- FY27 consensus formation post-print — does ~$3.59+ EPS hold or break
- Competitive read-throughs from Paramount/Skydance integration and YouTube TV viewing share data
Risks
- Binary event in 4 days: an ad/revenue miss on Oct 20 likely extends the de-rating below the 52-week low ($72.61 is only 5.2% above it)
- Engagement data (Wells Fargo ~8% viewing decline) may be confirmed by management, validating the structural-bear case
- Consensus EPS data is internally inconsistent ($3.36 vs $3.58-3.59 across sources) — the 20x multiple math rests on the higher figure
- $25B buyback authorization is [T3/T4]-sourced and pace is unconfirmed; it may be authorization theater rather than committed repurchases
- Reduced engagement disclosure from 2027 lowers transparency precisely when scrutiny is highest
What to watch
- Oct 20 print: ad revenue vs ~$806M, Q4 revenue guide, 2027 commentary tone
- Share count and repurchase dollars in the Q3 10-Q
- FY27 estimate revision breadth in the two weeks after earnings
- Nielsen/third-party TV viewing share: Netflix vs YouTube trend
- Any engagement commentary addressing the Wells Fargo viewing-decline data
Market snapshot when the call was made 2026-10-15
Price
| Return 1w | +1.2% |
| Return 1m | -9.4% |
| Return 3m | -5.1% |
| Return 6m | -34.5% |
| Return 1y | -94.2% |
| From 52-week high | -94.3% |
| Realized vol, 20d | 29.6% |
| SPY 3m / 1y | +2.5% / +16.1% |
| QQQ 3m / 1y | +3.3% / +21.1% |
Technicals
NFLX technicals as of 2026-10-15: last close $72.61; 20d SMA 70.38 (bearish); 50d SMA 75.16; 12d EMA 70.74; 26d EMA 71.93; RSI 14 55.0 (balanced); 20d vol 26.4%; volume x1.0 vs 20d avg
Sources (39 · T1 = primary filings)
- T1https://ir.netflix.net/investor-news-and-events/financial-releases/press-release-details/2026/WBD-Files-Defini…
- T1https://ir.netflix.net/investor-news-and-events/financial-releases/press-release-details/2026/Netflix-Supports…
- T1https://www.sec.gov/Archives/edgar/data/1437107/000143710726000057/wbd-20260331.htm
- T1https://ir.netflix.net/investor-news-and-events/financial-releases/press-release-details/2026/Netflix-and-Warn…
- T1https://www.sec.gov/Archives/edgar/data/1437107/000119312526055653/d113739ddfan14a.htm
- T1https://ir.wbd.com/news-and-events/financial-news/financial-news-details/2026/Warner-Bros--Discovery-Board-of-…
- T1https://www.sec.gov/Archives/edgar/data/1065280/000119312526053130/d102891ddfan14a.htm
- T1https://www.sec.gov/Archives/edgar/data/1437107/000119312526015985/d45064dsc14d9a.htm
- T1https://www.sec.gov/Archives/edgar/data/1065280/000106528026000211/ex991_q226.htm
- T4https://finance.yahoo.com/markets/stocks/articles/nflx-stock-dips-overnight-netflix-061815170.html
- T4https://www.investors.com/news/technology/netflix-stock-downgraded-to-sell-before-q3-report/
- T4https://finance.yahoo.com/markets/stocks/articles/netflix-stock-gets-downgraded-wells-204517647.html
- T4https://www.zacks.com/stock/news/2956698/netflixs-weak-outlook-overshadows-q2-earnings-beat-time-to-hold
- T4https://finance.yahoo.com/markets/stocks/article/netflix-could-stop-its-stock-free-fall-with-these-4-actions-k…
- T4https://www.perplexity.ai/finance/NFLX
- T4https://admiralmarkets.com/analytics/traders-blog/netflix-stock-analysis-october-2026
- T3https://www.cnbc.com/2026/10/06/paramount-wbd-deal-timeline.html
- T4https://finance.yahoo.com/markets/stocks/articles/paramount-paid-netflix-2-8-230000125.html
- T4https://techcrunch.com/2026/10/06/paramount-closes-historic-warner-bros-merger-to-form-skydance/
- T4https://finance.yahoo.com/media-advertising/articles/paramount-warner-bros-discovery-now-122000226.html
- T4https://techcrunch.com/2026/10/11/warner-bros-netflix-paramount-acquisition-timeline-wbd/?source=newscura
- T2https://www.reuters.com/business/media-telecom/paramount-wraps-up-mega-warner-bros-merger-create-hollywood-pow…
- T4https://en.wikipedia.org/wiki/Paramount_Media_Networks
- T1https://ddnews.gov.in/en/paramount-skydance-wins-warner-bros-netflix-walks-away-and-its-shares-jump/
- T3https://www.cnbc.com/2026/07/16/netflix-nflx-earnings-q2-2026.html
- T3https://www.spglobal.com/market-intelligence/en/news-insights/research/2026/07/netflix-postq-slower-advertisin…
- T4https://www.zacks.com/stock/news/2955750/netflix-q2-earnings-beat-stock-falls-on-revenue-miss-lower-outlook
- T4https://www.zacks.com/stock/news/2955489/netflix-q2-earnings-call-highlights-ai-ads-growth-plans
- T4https://fsm.global/sg/article/rcms381482/netflix-q2-2026-earnings-is-the-companys-reduced-transparency-a-red-f…
- T4https://news.alphastreet.com/netflix-nflx-q3-2026-preview-eps-est-0-82-reports-october-20/
- T1https://ir.netflix.net/investor-news-and-events/investor-events/event-details/2026/Netflix-Second-Quarter-2026…
- T4https://finance.yahoo.com/markets/stocks/articles/morgan-stanley-revises-netflix-stock-123512008.html
- T4https://tickeron.com/blogs/nflx-40-while-wbd-200-two-streaming-stocks-on-divergent-paths-18140/
- T1https://www.sec.gov/Archives/edgar/data/2041610/000110465926111174/tm2610616d13_ex99-2.htm
- T4https://www.marketbeat.com/instant-alerts/estimates-netflix-fy2027-earnings-forecast-lowered-by-erste-group-ba…
- T1https://www.sec.gov/Archives/edgar/data/1437107/000143710726000057/R9.htm
- T4https://news.futunn.com/en/post/1000606551/netflix-nflx-q3-2026-earnings-preview-key-themes-and-framework
- T4https://tickeron.com/ticker/WBD/signals/
- T4https://finbold.com/wall-street-analyst-updates-netflix-stock-price-target-2/
Earlier and later calls on NFLX
- Oct 14, 2026Yes — derated, not broken.Lean bullish
- Oct 10, 2026Fairly valued after the reset.Neutralview changed
- Oct 7, 2026Lean bullish — a reset, not a break.Lean bullish
- Oct 7, 2026Lean bullish into Oct 20.Lean bullish
Want a fresh look at NFLX, or another name?
Queue a new deep-research run. Published to the feed when done.
Automated research opinion, published as-is on Oct 16, 2026. Not personalised advice. Figures use end-of-day closes.