Lean bullish — a reset, not a break.
Thesis
Bull case
A 13%-growing, 31.5%-margin, $12.5B-FCF business at ~23x clean forward earnings with the largest buyback in company history running underneath it. Ads revenue doubling to $3B with 4,000+ advertisers is a multi-year monetization lever still in early innings; price increases remain available given flat engagement and low churn signals. If Q3 meets lowered guidance ($12.87B/$0.82) and January's viewing report shows stability, the multiple re-rates toward the high-20s — TD Cowen's $100 implies +45%.
Bear case
Growth deceleration is structural, not cyclical: 16%→13%→11.5% while YouTube captures the marginal hour of TV attention and the newly merged Paramount-WBD creates the first genuine content-scale competitor. Management's disclosure retreat (no members, annual-only viewing) plus Hastings' exit reads as insiders hiding a slowdown they can see and investors can't. Estimates embed the ad ramp and pricing power; if engagement softens into January's report, FY27 EPS comes down and even ~23x 'clean' proves expensive — Wells Fargo's $57 is -17% from here.
What would change our mind
- Q3 2026 revenue or EPS misses the already-lowered $12.86B/$0.82 guidance, or FY26 margin guide of 31.5% is cut
- FY27 consensus EPS ($3.82) is revised down more than ~5% over the next two quarters
- Nielsen Gauge shows Netflix share falling below ~7.5% of TV time for consecutive months
- January 2027 annual viewing report shows flat-to-declining view hours (vs +2% H1 2026)
- Buyback pace drops materially below the Q2 $4.7B rate without explanation
Since publication vs SPY · closed horizons are frozen
The full research everything the view rests on
Direct answer to the question asked
Where the edge would come from
What the price assumes
At ~$68.70 the market appears to assume further deceleration: Wells Fargo's $57 target implies engagement data deteriorates and FY27 estimates come down; consensus itself already embeds slowing growth (FY27 revenue +11.5%). Sentiment is washed out (RSI 27, 18 PT cuts post-Q2), so the price is set for disappointment, not delivery.
Why the market may be wrong
The bear narrative (softening engagement, weak slate) is currently stronger than the public evidence: Nielsen Gauge shows Netflix at ~7.9-8.8% of US TV time through Aug 2026 — flat, not falling — while YouTube's gains come from a different content model that doesn't directly cannibalize paid viewing. Meanwhile management's actions (largest-ever $4.7B quarterly buyback at depressed prices) contradict its worried-sounding disclosure choices. If Q3 merely meets already-lowered guidance and the January viewing report shows stability, the multiple has room to re-rate toward the mid-20s.
The one thing to watch
Headline 'NFLX at 19x forward' is an artifact: the $2.8B WBD termination fee inflated Q1 2026 EPS by roughly $0.60+, so the clean forward multiple is ~23x — and the genuinely decisive variable is no longer earnings at all, but a single disclosure event: the January 2027 annual viewership report, now the only engagement number Netflix publishes. Wells Fargo explicitly flagged it as the next negative catalyst; a smart holder should treat that date, not the Oct 20 print, as the thesis adjudicator.
Key evidence (10)
- 10-for-1 split confirmed by SEC data: FY24 diluted EPS $19.83 vs FY25 $2.53 on higher net income ($8.71B→$10.98B) [T1 SEC XBRL]
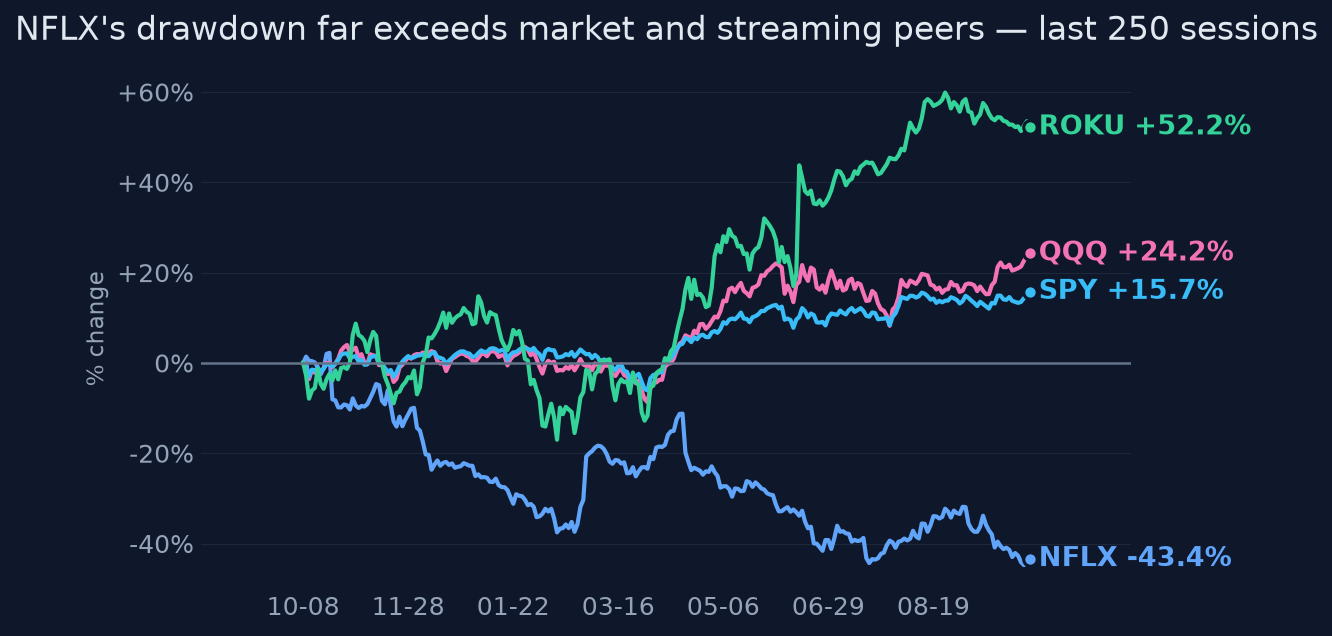
- 1y return -40.4%, max drawdown -46%, vs SPY +16.4% / QQQ +25.9% / ROKU +46.4%; 60d correlation to QQQ 0.04, idiosyncratic share 94-100% [market data, 2026-10-06]
- FY26 guidance: revenue $51.0-51.4B (+13-14%), operating margin 31.5% held, ads revenue doubling to ~$3B, FCF ~$12.5B [T1 Netflix IR / T2 Reuters, Jul 16 2026]
- Q1 2026 net income $5.28B / EPS $1.23 was boosted by a $2.8B WBD termination fee (~$0.60+/sh) — headline FY26 consensus of $3.59 embeds it; clean run-rate ~$2.95-3.30 [T3 CNBC, T2 Reuters, Apr-May 2026]
- Q2 2026 in line ($12.56B rev, $0.80 EPS) but Q3 guided below consensus ($12.86B/$0.82 vs ~$13.0B/$0.84); stock -9%+, ≥18 analyst PT cuts [T2 Reuters, Jul 17 2026]
- View hours grew only ~2% in H1 2026; Netflix cut viewing-hour disclosure to once yearly from 2027 after already ending subscriber counts [T2 Reuters]
- Nielsen Gauge: Netflix ~8.8% (Jan 2026) → 8.0% (May) → 7.9% (Aug) of US TV time; YouTube 12.5%→13.5-13.8%; Disney ~10-12% [T4 Nielsen, consistent across months]
- Wells Fargo downgrade to Underweight, $57 target (Sep 18 2026), flagging Jan 2027 viewership report as next negative catalyst; TD Cowen reiterated $100 (Oct 5 2026) [T2/T4]
- Record $4.7B buyback in Q2 2026, $27.1B authorization remaining vs ~$288B market cap [T4, from Q2 materials]
- Paramount-WBD merger closed early Oct 2026, combining Paramount+ and HBO Max under Skydance [T3 CNBC]
Catalysts and risks
Catalysts
- Q3 2026 earnings Oct 20, 2026: consensus ~$12.87B rev / $0.82 EPS; watch ad-revenue trajectory vs $3B, 2027 content-spend signals, churn/pricing commentary
- Q4 2026 earnings Jan 18, 2027 (consensus $0.75 EPS / $13.79B rev)
- January 2027 annual viewership report — the sole remaining engagement disclosure and Wells Fargo's flagged negative catalyst
- Monthly Nielsen Gauge releases through year-end — watch whether Netflix holds ~8% or slips below
- Post-merger Paramount-WBD (Skydance) integration moves and any HBO Max/Paramount+ bundling or pricing aggression
- Pace of buybacks in Q3 — whether management accelerates repurchases at these levels
Risks
- January viewership report confirms engagement deterioration, validating the bear thesis and triggering FY27 estimate cuts
- Disclosure opacity means negative trends can compound invisibly for quarters before surfacing
- Paramount-WBD combination competes more effectively for content and subscribers than either did separately
- Clean FY26 EPS uncertainty: the $3.59 consensus embeds the one-time fee; if the market is anchored on headline P/E, 'cheapness' is partly illusory
- Ad-revenue ramp disappoints vs the $3B target, undermining the key remaining growth lever
- Beta 1.6 — any broad market drawdown amplifies NFLX downside
What to watch
- Oct 20 Q3 print vs $12.87B/$0.82 consensus and any FY26 guide change
- Ad revenue commentary vs the ~$3B 2026 target and 4,000+ advertiser base
- 2027 content-spend signals on the Q3 call — the key margin trajectory variable
- Q3 buyback dollar volume (capital return conviction test)
- Monthly Nielsen Gauge: Netflix share vs the ~8% floor and YouTube's continued ascent
- Paramount-WBD post-merger streaming pricing/bundling announcements
- Analyst revision trend on FY27 EPS between now and January
Market snapshot when the call was made 2026-10-06
Price
| Return 1w | -2.3% |
| Return 1m | -12.2% |
| Return 3m | -9.1% |
| Return 6m | -30.5% |
| Return 1y | -40.4% |
| From 52-week high | -44.7% |
| Realized vol, 20d | 32.9% |
| SPY 3m / 1y | +4.5% / +16.4% |
| QQQ 3m / 1y | +6.8% / +25.9% |
Technicals
NFLX technicals as of 2026-10-06: last close $68.69; 20d SMA 72.56 (bearish); 50d SMA 75.48; 12d EMA 70.14; 26d EMA 72.67; RSI 14 27.3 (oversold); 20d vol 32.7%; volume x1.0 vs 20d avg
Next earnings: 2027-01-18 AMC
Verifier notes PASS
Unsupported claims
- Bull case asserts 'low churn signals' justify further pricing power — the evidence bundle contains no churn data at all (churn appears only as a watch item), and the digest explicitly notes member-level metrics are now opaque since Netflix discontinued subscriber reporting. This is an unsupported embellishment, though minor to the overall thesis.
Weakly sourced
- The record $4.7B Q2 buyback and $27.1B remaining authorization — a core pillar of the bull case and cited in the direct_answer — rest solely on T4-tagged sources (MarketBeat/Yahoo search synthesis), with no T1/T2 confirmation in the bundle. The opinion does transparently tag it [T4], which mitigates but does not resolve the sourcing gap.
- The Nielsen Gauge engagement trend (Netflix ~7.9-8.8% of TV time), which underpins the central 'flat, not collapsing' argument, is supported only by T4 citations. It is consistent across three monthly readings and the digest flags this limitation, so it is tolerable, but it is the load-bearing empirical claim of the thesis.
Corrections applied
- Optional, non-material: soften 'low churn signals' to 'no reported churn deterioration' or remove it, since churn is unobservable under current disclosure.
- Optional, non-material: if T1/T2 confirmation of the $4.7B/$27.1B buyback figures is unavailable, note in the risks section that the buyback pillar rests on secondary-source reporting.
Sources (32 · T1 = primary filings)
- T2https://www.reuters.com/sustainability/boards-policy-regulation/time-inc-discovery-warner-bros-breakup-puts-sp…
- T2https://www.reuters.com/business/media-telecom/lacks-excitement-netflix-tumbles-9-weak-earnings-forecast-deepe…
- T2https://www.reuters.com/business/finance/netflix-paramount-shares-jump-months-long-fight-warner-bros-ends-2026…
- T2https://www.reuters.com/legal/transactional/warner-bros-says-paramount-bid-superior-countdown-begins-netflix-r…
- T2https://www.reuters.com/world/11-us-states-urge-doj-thoroughly-probe-netflix-warner-bros-deal-2026-02-25/
- T4https://stockanalysis.com/stocks/nflx/transcripts/650439-q2-2026/
- T2https://www.reuters.com/business/netflix-shares-fall-after-downbeat-revenue-forecast-co-founder-leave-2026-04-…
- T2https://www.reuters.com/business/finance/netflix-submits-amended-all-cash-offer-warner-bros-wins-board-support…
- T4https://www.nielsen.com/data-center/the-gauge/
- T4https://finance.yahoo.com/markets/stocks/article/paramount-warner-bros-discovery-merger-closes-after-nearly-ye…
- T4https://www.nielsen.com/news-center/2026/streaming-embarks-on-annual-summer-ascent-in-nielsens-may-2026-gauge-…
- T4https://axis-intelligence.com/streaming-statistics/
- T4https://www.paramount.com/press/paramount-to-acquire-warner-bros-discovery-to-form-next-generation-global-medi…
- T3https://www.cnbc.com/2026/10/06/paramount-wbd-deal-timeline.html
- T4https://www.nielsen.com/news-center/2026/disney-scores-best-performance-in-a-year-in-nielsens-january-2026-med…
- T4https://www.mediapost.com/publications/article/416872/streaming-viewing-share-hits-record-high-in-may-n.html
- T4https://www.marketbeat.com/stocks/NASDAQ/NFLX/forecast/
- T4https://www.theglobeandmail.com/investing/markets/stocks/DIS/pressreleases/4427642/netflix-stock-rebound-fuels…
- T4https://www.insiderfinance.io/news/netflix-q3-2026-earnings-oct-20
- T4https://finance.yahoo.com/markets/stocks/articles/netflix-momentum-despite-being-down-123355121.html
- T4https://admiralmarkets.com/analytics/traders-blog/netflix-stock-analysis-october-2026
- T4https://www.perplexity.ai/finance/NFLX/analysis
- T4https://note.com/ny_bird/n/n1fa28f251b2c?hl=en
- T4https://finance.yahoo.com/markets/stocks/articles/netflix-could-one-market-biggest-145837434.html
- T3https://www.cnbc.com/2026/04/16/netflix-nflx-earnings-q1-2026.html
- T4https://tech-insider.org/netflix-q1-2026-earnings-revenue-subscribers-wbd-termination-fee/
- T4https://thedesk.net/2026/04/netflix-q1-2026-earnings-report/
- T4https://www.moomoo.com/news/notice/306963443/netflix-10-q-q1-2026-earnings-report
- T4https://note.com/edger_signal/n/n775e0f0eaeed?hl=en
- T4https://www.marketbeat.com/instant-alerts/netflix-nasdaqnflx-issues-earnings-results-2026-04-16/
- T4https://www.marketbeat.com/earnings/reports/2026-4-16-netflix-inc-stock/
- T2https://www.reuters.com/legal/transactional/warner-bros-discoverys-streaming-growth-accelerates-global-hbo-max…
Earlier and later calls on NFLX
- Oct 16, 2026De-rating overdone, but catalyst-gated.Lean bullish
- Oct 14, 2026Yes — derated, not broken.Lean bullish
- Oct 10, 2026Fairly valued after the reset.Neutralview changed
- Oct 7, 2026Lean bullish into Oct 20.Lean bullish
Want a fresh look at NFLX, or another name?
Queue a new deep-research run. Published to the feed when done.
Automated research opinion, published as-is on Oct 7, 2026. Not personalised advice. Figures use end-of-day closes.