No clear edge at $27.
Thesis
Bull case
Growth is accelerating, not decelerating (46-48% with three straight quarters of acceleration), AI is a monetization lever already contributing revenue (AI credits), NDR in the 130s rules out seat compression, guidance has been raised twice, and at ~9x forward sales the valuation is no longer absurd for a 45% grower with 82% gross margins. Adjusted EPS is positive and being revised up, so the GAAP-loss headline overstates the profitability problem (the exact SBC/one-time split still needs 10-K verification). If Q3 shows AI revenue scaling with improving incremental margins, the 'prove profitability' overhang lifts and the stock re-rates from a depressed base — upside toward prior consolidation levels is large given the -78% drawdown.
Bear case
The stock is still ~120x forward adjusted EPS with GAAP operating losses whose composition is unverified — if the FY25 $1.29B operating loss is NOT mostly one-time/non-cash, the profitability problem is worse than bulls assume. Management itself declined to raise operating income guidance alongside revenue, and the recent 35% rally was macro beta (soft-CPI software rally), not fundamental. If AI costs scale with AI revenue — the pattern so far — margin expansion keeps getting pushed out, and a 97%-vol stock trading on sector sentiment can give back the entire August bounce on any risk-off tape or a Q3 that repeats the beat-revenue/miss-margin pattern.
What would change our mind
- Bull-side invalidation: Q3 2026 shows revenue growth decelerating below ~40% YoY while operating income guidance stays flat or is cut — that confirms the margin-trap bear case
- Bear-side invalidation: Q3 2026 shows operating income guidance raised alongside revenue, or management quantifies AI credit revenue with positive incremental margins — that resolves the profit-quality question bullishly
- Either side: NDR falling below ~125% would signal the seat-compression threat is arriving after all
- If 10-K/filing data shows the FY25 GAAP loss is primarily recurring cash operating expense rather than SBC/one-time items, the 'adjusted profitability is real' leg of the bull case weakens materially
Since publication vs SPY · closed horizons are frozen
The full research everything the view rests on
Direct answer to the question asked
Where the edge would come from
What the price assumes
At ~120x FY26 and ~99x FY27 consensus EPS (stockanalysis/Yahoo aggregates [T4]), the price still assumes sustained ~40%+ growth with eventual significant margin expansion. The post-Q2 selloff despite a raised revenue forecast shows the market has stopped rewarding top-line beats alone and now demands evidence that AI investment yields operating leverage rather than permanent cost escalation.
Why the market may be wrong
Consensus may be wrong in either direction. Bears extrapolate GAAP losses and AI-cost inflation, but adjusted EPS is positive ($0.08 in Q2, beating consensus) and being revised upward — the gap between the large FY25 GAAP loss and positive adjusted EPS plus an 82% gross margin suggests heavy non-cash or one-time items (plausibly IPO-period SBC), though the bundle contains no SBC breakdown, so exactly how much of the GAAP loss is an artifact is unverified from this evidence. Bulls extrapolate 46-48% growth, but management holding operating income guidance flat while raising revenue by $40M is a real signal that incremental AI revenue may carry poor incremental margins. The evidence supports neither full narrative yet.
The one thing to watch
The AI-disruption question is effectively settled in Figma's favor for now — the live variable has changed. What matters is not 'does AI kill Figma' but the marginal economics of Figma's own AI: the $40M FY26 guidance raise came with zero change to operating income guidance, implying AI-driven revenue currently carries ~0% incremental margin. Watch whether Q3 shows the first sign of AI credit revenue scaling profitably — that single data point will decide whether this is a 9x-sales compounder or a growth-into-margin-trap.
Key evidence (7)
- Q2 2026 results (Aug 5, 2026): revenue beat, adjusted EPS $0.08 beat, GAAP net loss $112.2M; FY26 revenue guidance raised to $1.463-1.467B from $1.422-1.428B (Reuters [T2], Figma IR [T1])
- FY26 operating income guidance maintained (not raised) despite the $40M revenue raise — market sold off on margin concerns (Reuters [T2])
- Transcript coverage: Q2 was 'first full quarter of AI monetization'; third straight quarter of accelerating growth; NDR mid/high-130s (Yahoo/Investing.com transcripts [T4], corroborated by IR releases [T1])
- FY2025 SEC XBRL: revenue $1.056B, gross margin 82.4%, GAAP operating loss $1.29B (SEC companyfacts [T1]). The composition of that loss is NOT in the bundle — no SBC or one-time-item figures were pulled — so whether it is dominated by non-cash/IPO-related charges is an assumption to verify from the 10-K, not an established fact
- Valuation: market cap $13.2B at $27.10; forward P/E ~120x FY26 / ~99x FY27 consensus; ~9x FY26 sales (profile data; stockanalysis [T4])
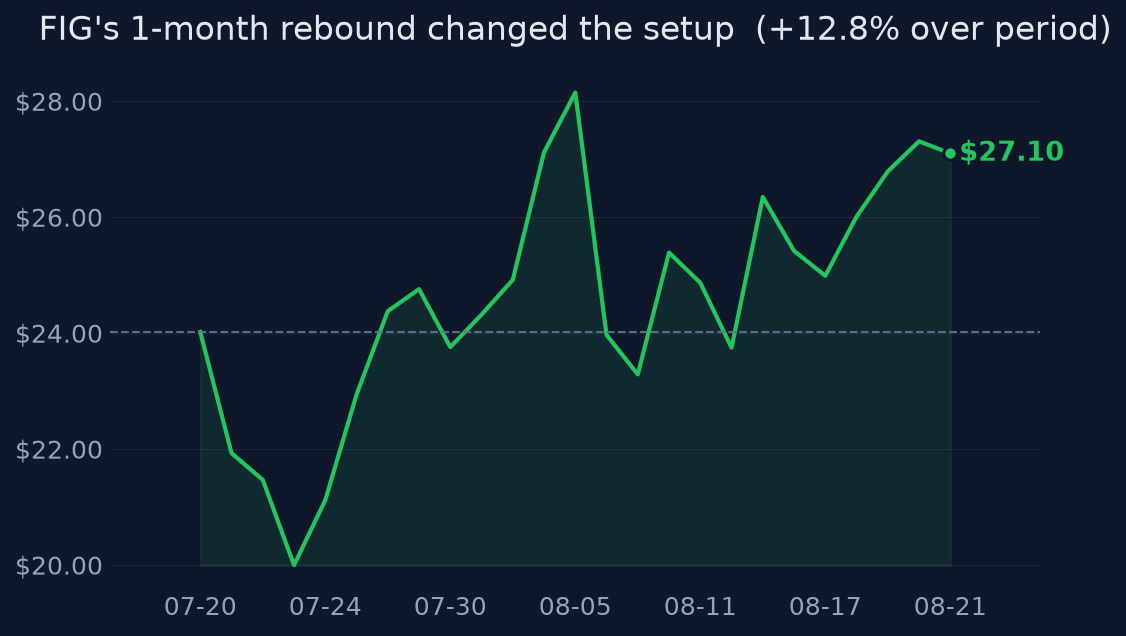
- Price action: -77.8% below 52w high, max drawdown -86%, +35.5% in the last month, realized vol ~97%; August rebound attributed to macro/sector rally after soft inflation data, not company-specific news ([T4] research synthesis)
- Discrepancy note: one tool pull cited Q2 revenue of $333.4M while another cited $370.1M with Q1 at $333.4M — figures across tools are inconsistent on quarter labeling; both indicate ~46-48% YoY growth
Catalysts and risks
Catalysts
- Q3 2026 earnings (likely early-to-mid November 2026) — first read on whether AI monetization produces incremental operating leverage
- Any disclosure quantifying AI credit revenue mix (management flagged 'strong AI credit monetization' in Q2)
- FY25 10-K / future filings revealing the SBC and one-time-item composition of the GAAP loss — resolves the 'artifact vs real' profitability debate
- Competitive moves: Adobe's AI-first ARR ($500M+ and tripling per Adobe) and Canva AI 2.0 launches
- Macro: further inflation/rate data driving the high-multiple software tape that powered the August rebound
Risks
- Structural margin dilution from AI compute and go-to-market spend (already visible in flat opex-adjusted guidance)
- Re-rating risk: 120x forward EPS leaves no cushion if growth decelerates below ~40%
- The 35% one-month rally is macro-driven and reversible — 97% annualized vol cuts both ways
- GAAP loss composition is unverified in this bundle; if the FY25 loss is not mostly non-cash/one-time, the bear case on profitability is stronger than assumed here
- Competitive intensification from Adobe (AI-first ARR tripled) and Canva, plus AI-native builders pressuring pricing/packaging
- Residual post-IPO share-supply dynamics and insider selling cannot be ruled out (lockup structure per S-1/A [T1])
What to watch
- The spread between revenue guidance changes and operating income guidance changes each quarter — the single cleanest measure of AI incremental margin
- Explicit AI credit revenue disclosure or KPI in Q3 materials
- SBC and one-time-item lines in the FY25 10-K to establish what the GAAP loss actually consists of
- Net dollar retention trend (mid-130s currently)
- Whether the August macro bid in high-multiple software persists through the next inflation prints
- Adobe/Canva AI monetization numbers as a category-health cross-check
Market snapshot when the call was made 2026-08-21
Price
| Return 1w | +6.6% |
| Return 1m | +35.5% |
| Return 3m | +25.5% |
| Return 6m | +3.9% |
| Return 1y | -63.4% |
| From 52-week high | -77.8% |
| Realized vol, 20d | 97% |
| SPY 3m / 1y | +3.1% / +20.0% |
| QQQ 3m / 1y | -0.2% / +26.0% |
Technicals
FIG technicals as of 2026-08-21: last close $27.10; 20d SMA 25.28 (bullish); 50d SMA 22.46; 12d EMA 25.84; 26d EMA 24.72; RSI 14 55.9 (balanced); 20d vol 92.2%; volume x0.5 vs 20d avg
Verifier notes REVISE · opinion revised once
Unsupported claims
- 'FY25's $1.25B GAAP loss is dominated by IPO-related SBC' (repeated as 'GAAP losses dominated by IPO-period SBC' in key_evidence). The evidence bundle contains no SBC figures whatsoever — the SEC XBRL pull gives FY25 revenue, net income, EPS, gross profit, and operating loss, but no stock-based compensation line, and none of the research answers quantify or attribute the loss to IPO-period SBC. This is a specific causal/factual assertion stated as fact, and it materially underpins the opinion's rebuttal of the bear case ('the unprofitable framing is partially an artifact'). It may well be true in reality, but it is not supported by anything in this bundle.
Corrections applied
- Either (a) pull actual SBC figures from the FY25 10-K/S-1 before asserting the loss composition, or (b) reword to acknowledge the evidence gap, e.g.: 'FY25's $1.25B GAAP loss versus an 82% gross margin and positive adjusted EPS suggests the loss is likely driven by large non-cash or one-time items (plausibly IPO-period SBC), but the bundle does not contain the SBC breakdown — this should be verified from the 10-K before treating the 'unprofitable' framing as an artifact.' The downstream sentence 'adjusted EPS is positive and being revised upward' is supported and can stand on its own without the SBC claim.
Sources (15 · T1 = primary filings)
- T4https://finance.yahoo.com/quote/FIG/earnings/FIG-Q2-2026-earnings_call-669452.html/
- T4https://www.fool.com/earnings/call-transcripts/2026/05/15/figma-fig-q1-2026-earnings-call-transcript/
- T1https://investor.figma.com/news-events/news/news-details/2026/Figma-Announces-First-Quarter-2026-Financial-Res…
- T1https://investor.figma.com/financials/quarterly-results/default.aspx
- T4https://www.investing.com/news/transcripts/earnings-call-transcript-figma-beats-q2-2026-estimates-but-stock-fa…
- T4https://earningscall.biz/e/nyse/s/fig/y/2026/q/q1
- T1https://investor.figma.com/news-events/news/news-details/2026/Figma-Announces-Second-Quarter-2026-Financial-Re…
- T4https://finance.yahoo.com/markets/stocks/articles/figma-inc-fig-q1-2026-050023577.html
- T2https://www.reuters.com/technology/figma-lifts-annual-revenue-forecast-ai-efforts-drive-solid-demand-2026-08-0…
- T2https://www.reuters.com/company/figma-inc/
- T4https://www.investing.com/news/transcripts/earnings-call-transcript-figmas-q1-2026-beats-expectations-with-str…
- T2https://www.reuters.com/markets/companies/FIG.N/
- T4https://finance.yahoo.com/markets/stocks/articles/figma-q1-2026-earnings-beat-110945684.html
- T2https://www.reuters.com/technology/figma-forecasts-annual-revenue-above-estimates-design-software-gains-moment…
- T2https://www.reuters.com/technology/figma-raises-annual-revenue-forecast-ai-drives-strong-design-demand-2026-05…
Earlier and later calls on FIG
- Sep 25, 2026Business strong; stock a speculative buy.Lean bullishview changed
- Sep 15, 2026Yes — but only in small size.Lean bullishview changed
- Sep 8, 2026Yes — massively, but not cheaply.No clear edge
- Aug 14, 2026Multiple compression, not deterioration.Lean bullishview changed
Want a fresh look at FIG, or another name?
Queue a new deep-research run. Published to the feed when done.
Automated research opinion, published as-is on Aug 23, 2026. Not personalised advice. Figures use end-of-day closes.