Multiple compression, not deterioration.
Thesis
Bull case
Figma tracks or beats its raised FY26 guide, Q3 shows AI-credit revenue is recurring consumption, and consensus FY27 growth gets revised from +24% toward ~+30% (~$1.9B revenue). Corrected arithmetic: at 8-9x FY27E sales on the current $1.82B consensus, equity value is ~$16.2-18.0B, or ~$33-37/share (+30-46%); if revenue is also revised to ~$1.9B, 8x yields ~$35-39. Note this DOES embed a re-rating from ~5.9x to 8x — roughly 35% multiple expansion — so the honest framing is that upside comes from revisions and re-rating together, not revisions alone. A revision-only path at a constant multiple caps out in the high-$20s. GAAP profitability inflection as SBC normalizes supports the re-rating leg, and the Feb 2026 guidance-driven jump demonstrates the stock's sensitivity to exactly this catalyst.
Bear case
The +24% FY27 consensus is foresight, not conservatism: AI-native tools (Lovable, v0, Cursor) plus Canva/Adobe compress seat growth faster than credits can offset, and the 450bps gross-margin compression is the leading edge of structurally lower AI-era margins. AI-credit revenue proves to be a one-time enforcement catch-up that laps in H2'26, making the raised guide a high-water mark. Post-lockup float expansion plus ongoing 10b5-1 selling caps rallies, and at ~107% realized vol any SaaS de-rating leg takes FIG back toward the high-teens (-25-30%). Note the bear case is symmetric with the bull case in magnitude — roughly -25-30% downside vs. +30-46% upside — which is why this is a lean, not a strong, conviction.
What would change our mind
- Q3 2026 revenue comes in below the $373M guide low end, or FY26 guidance is cut/held after the August raise
- NDR drops below ~125% — would signal the seat-erosion/AI-disruption thesis is arriving in the numbers
- Management discloses AI-credit revenue is non-recurring or consumption is declining QoQ
- Gross margin falls below ~82% with commentary attributing it to structural AI costs rather than investment timing
- FY27 consensus revenue estimates get CUT from $1.82B — that would mean the deceleration fear is being confirmed, not priced
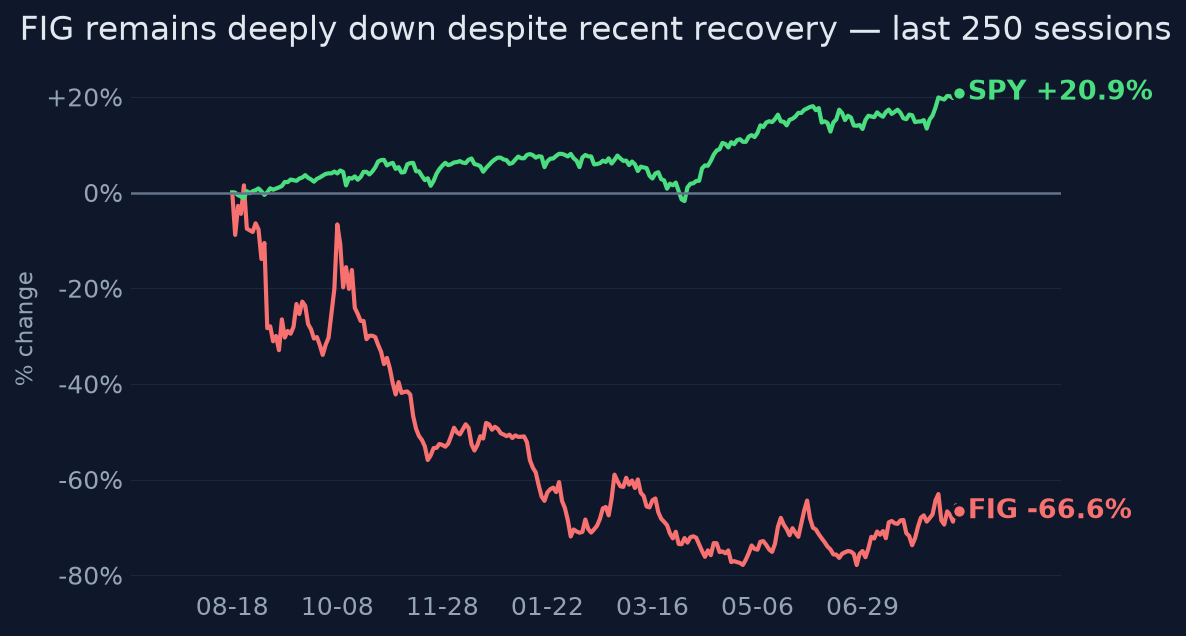
Since publication vs SPY · closed horizons are frozen
The full research everything the view rests on
Direct answer to the question asked
Where the edge would come from
What the price assumes
At $25.42 / ~$12.4B market cap (~$10.7B EV on $1.67B cash — note: share count is implied, not filing-verified), the stock trades at roughly 7x FY26E and 6x FY27E consensus sales. Consensus explicitly models growth halving from +48% to +24% in FY27, treats AI-credit revenue as low-quality, and applies a SaaS-de-rating multiple despite 85% gross margins and 14% FCF margins. The price assumes the AI threat to design seats is real and merely delayed.
Why the market may be wrong
Three specific places: (1) The FY27 +24% deceleration is a modeling convention, not an observed trend — NDR of 136% and a $40M guidance raise argue the slowdown is being over-extrapolated. (2) AI-credit data (>75% of over-limit enterprise users still consuming, >95% retained) suggests consumption revenue is sticky, and management attributed part of the raise to it — the market assigns this little value. (3) The FY25 GAAP loss (-$1.25B) that scared investors was one-time IPO-vesting SBC; H1'26 SBC is only ~$60M with no unrecognized option SBC remaining, so GAAP profitability inflection in FY26-27 is under-appreciated.
The one thing to watch
The variable to watch is not seat growth or AI headlines — it is whether Q3 classifies AI-credit revenue as durable consumption rather than one-time enforcement catch-up. But be precise about the transmission mechanism: FY27 estimate revisions alone, at a constant ~6x forward-sales multiple, only get the stock to the high-$20s; the 30%+ upside case requires the credit-durability confirmation to drive BOTH the revision and a modest re-rating toward 8x. If you believe only in the revision channel, the edge here is much smaller than the headline drawdown suggests.
Key evidence (10)
- Q2 2026 (reported Aug 5, 2026): revenue $370M, +48% YoY; NDR 136%; 85% gross margin; 10% non-GAAP op margin; FCF $53.2M (14% margin); cash $1.67B (Figma IR [T1]; Reuters [T2] 2026-08-05)
- FY26 revenue guidance raised $40M to $1.463-1.467B (~39% growth at midpoint); Q3 guided $373-375M (Reuters [T2] 2026-08-05)
- Estimates revised UP over the trailing 3 months (FY26 EPS $0.28→$0.29, FY27 $0.34→$0.36, WSJ [T2]) — a window during which the stock actually ROSE ~26%; the -69% figure is the 1-year return and no revision data spans that full year, so the correct framing is: estimates rising while the stock remains ~69% below its year-ago level
- Crash timeline: Sept 4, 2025 post-IPO earnings beat but stock slumped on lockup overhang and 'priced for perfection' (Reuters [T2]); Class B lockup expired Jan 27, 2026 ([T4]); Feb 19, 2026 strong outlook sparked recovery (Reuters [T2])
- AI monetization: credits enforced Mar 2026; >75% of over-limit Org/Enterprise users still consuming in April, >95% retained; Make weekly usage 60% of >$100k-ARR customers vs ~50% prior quarter (Figma IR/Q1'26 call [T1])
- FY25 GAAP loss -$1.25B was IPO-vesting SBC; H1'26 SBC only $60.4M, no unrecognized option SBC remaining as of Jun 30, 2026 (10-Q via StockTitan [T4] — filing-level detail, acceptable but verify)
- Gross margin compressed ~450bps YoY (85% vs ~89.5%) — AI inference costs are real (implied from reported figures)
- Insider sales July 2026 (CTO ~261k shares, GC) were routine 10b5-1; no 2026 secondary offering found ([T4])
- Valuation math check (verification): at ~487M implied shares and $1.67B cash, 8-9x FY27E sales of $1.82B implies ~$33-37/share (+30-46%); reaching $45 requires ~11x FY27E sales — genuine multiple expansion; revision-only at a constant ~5.9x multiple implies only high-$20s
- Stock +51% off Feb 2026 low, +26% 3m, technicals bullish, RSI 56; but 20d realized vol ~107% — position sizing matters (market data, 2026-08-14)
Catalysts and risks
Catalysts
- Q3 2026 earnings (~early Nov 2026): first clean read on AI-credit revenue durability and whether FY26 guide gets raised again
- FY27 initial guidance (Feb 2027 earnings) — the direct test of the +24% deceleration assumption
- Any disclosure breaking out AI-credit/Make revenue as a separate line
- GAAP operating profitability inflection as IPO SBC rolls off (H2'26)
- Competitive launches from Adobe (Firefly/Express AI), Canva, or AI-native builders that visibly target Figma's enterprise base
Risks
- AI-credit revenue is one-time enforcement catch-up, not durable consumption — removes a key pillar of the raised guide
- FY27 deceleration to +24% proves accurate or optimistic; growth stocks de-rate violently when 40% growth becomes 20%
- Gross margin compression from AI inference costs continues (already ~450bps YoY)
- Diluted share count and RSU overhang not filing-verified; post-lockup float expansion is a persistent supply headwind
- EPS consensus is internally inconsistent across sources ($0.06 vs $0.29 FY26) — GAAP/non-GAAP mismatch means earnings-based signals are unreliable
- ~107% annualized realized volatility: sizing errors are expensive even if the thesis is right
- Upside math is less asymmetric than the raw drawdown implies: revision-only upside is ~high-$20s; the 30-46% case requires multiple expansion that the market may not grant
What to watch
- Q3 print: AI-credit consumption trend and whether management quantifies it as recurring
- NDR trajectory (136% → anything below ~125% is a red flag)
- Gross margin: stabilization at ~85% vs. continued compression
- FY27 consensus revisions into year-end — the single number that closes or widens the valuation gap
- Whether the forward-sales multiple holds ~6x or begins re-rating — needed for the 30%+ upside case, not just the revision
- 10b5-1 selling cadence and any new secondary/insider block sales as float normalizes
- Adobe/Canva AI product traction and any enterprise-win/loss commentary on the earnings call
Market snapshot when the call was made 2026-08-14
Price
| Return 1w | +9.2% |
| Return 1m | +8.6% |
| Return 3m | +25.6% |
| Return 6m | +15.4% |
| Return 1y | -69.0% |
| From 52-week high | -79.2% |
| Realized vol, 20d | 107.7% |
| SPY 3m / 1y | +4.8% / +21.0% |
| QQQ 3m / 1y | +2.4% / +26.2% |
Technicals
FIG technicals as of 2026-08-14: last close $25.42; 20d SMA 24.10 (bullish); 50d SMA 21.93; 12d EMA 24.83; 26d EMA 23.89; RSI 14 56.4 (balanced); 20d vol 106.6%; volume x0.5 vs 20d avg
Verifier notes REVISE · opinion revised once
Unsupported claims
- Bull case: 'a revision-driven move to 8-9x FY27E sales implies $35-45 (40-75% upside)'. The arithmetic does not support this. Using the opinion's own figures (~487M implied shares, $1.67B cash, FY27E revenue $1.82B): 8-9x FY27E sales = EV of $14.6-16.4B, equity value of $16.2-18.0B, implying ~$33-37 per share (~30-46% upside), not $35-45. Even if FY27 revenue is revised up to ~+30% (~$1.9B), 8-9x yields only ~$35-39. Reaching $45 requires ~11x FY27E sales — multiple heroics the opinion explicitly disclaims.
- Answer/key_evidence: 'estimates were revised UP over past 3 months while the stock fell.' The evidence shows the WSJ revision window is the trailing 3 months (FY26 EPS $0.28→$0.29, FY27 $0.34→$0.36), during which the stock actually ROSE +25.6% (3m return). The -69% decline is a 1-year figure; the evidence contains no revision data spanning that full year. The claim conflates two different windows and misstates the stock's direction over the revision window.
Internal inconsistencies
- The bull case relies on the multiple re-rating from the current ~5.9x to '8-9x FY27E sales' — that IS multiple expansion of ~35-50% — while most_differentiated_insight states 'the entire valuation gap closes through that revision channel rather than through multiple expansion.' These two statements contradict each other: the stated price path in the bull case requires the very multiple expansion the differentiated insight disclaims.
Corrections applied
- Fix the bull-case math: either restate the target as ~$33-37 at 8-9x FY27E sales (~30-46% upside), or explicitly acknowledge that reaching $45 requires ~11x FY27E sales (i.e., genuine multiple expansion) and drop the 'without any multiple heroics' framing.
- Reconcile the revision-vs-multiple narrative: either the gap closes via FY27 estimate revisions at a roughly constant multiple (which yields a smaller price move than the bull case states), or via a re-rating to 8-9x (which is multiple expansion) — pick one mechanism and make the bull case and most_differentiated_insight consistent.
- Correct the revision-window claim to: 'consensus estimates were revised UP over the past 3 months even though the stock remains ~69% below its year-ago level / ~79% below its 52-week high' — avoiding the false implication that the stock fell during the 3-month revision window, when it actually rose ~26%.
Sources (23 · T1 = primary filings)
- T1https://investor.figma.com/financials/sec-filings/sec-filings-details/default.aspx?FilingId=19341541
- T2https://www.reuters.com/technology/figma-shares-slump-earnings-miss-lofty-post-ipo-expectations-2025-09-04/
- T1https://investor.figma.com/financials/sec-filings/default.aspx
- T4https://finance.yahoo.com/markets/stocks/articles/figma-q2-2026-earnings-beat-140019235.html
- T2https://www.reuters.com/technology/figma-lifts-annual-revenue-forecast-ai-efforts-drive-solid-demand-2026-08-0…
- T4https://www.stocktitan.net/sec-filings/FIG/8-k-figma-inc-reports-material-event-8e2472f3bc44.html
- T4https://www.marketscreener.com/news/59-037-192-class-b-common-stock-of-figma-inc-are-subject-to-a-lock-up-agre…
- T4https://www.stocktitan.net/sec-filings/FIG/144-figma-inc-sec-filing-66318e3c8a64.html
- T1https://investor.figma.com/news-events/news/news-details/2026/Figma-Announces-First-Quarter-2026-Financial-Res…
- T4https://www.stocktitan.net/sec-filings/FIG/10-k-figma-inc-files-annual-report-4012f620a72e.html
- T2https://www.reuters.com/business/figma-jumps-ai-push-boosts-software-design-spending-2026-02-19/
- T4https://finance.yahoo.com/news/figma-fig-12-6-ai-231215511.html
- T4https://www.figma.com/reports/
- T4https://www.fool.com/earnings/call-transcripts/2026/05/15/figma-fig-q1-2026-earnings-call-transcript/
- T4https://finance.yahoo.com/quote/FIG/earnings/FIG-Q2-2026-earnings_call-669452.html/
- T1https://investor.figma.com/financials/quarterly-results/default.aspx
- T4https://www.stocktitan.net/sec-filings/FIG/10-q-figma-inc-quarterly-earnings-report-f38b1fc0ca6f.html
- T4https://quartr.com/companies/figma-inc_20892
- T4https://www.investing.com/news/transcripts/earnings-call-transcript-figma-beats-q2-2026-estimates-but-stock-fa…
- T4https://www.tradingkey.com/news/earnings/262079231-tradingkey
- T4https://finance.yahoo.com/markets/stocks/articles/figma-q2-earnings-call-highlights-070410586.html
- T1https://investor.figma.com/news-events/events-and-presentations/default.aspx
- T4https://stockcircle.com/insider-trades/fig
Earlier and later calls on FIG
- Sep 25, 2026Business strong; stock a speculative buy.Lean bullish
- Sep 15, 2026Yes — but only in small size.Lean bullish
- Sep 8, 2026Yes — massively, but not cheaply.No clear edgeview changed
- Aug 23, 2026No clear edge at $27.No clear edgeview changed
Want a fresh look at FIG, or another name?
Queue a new deep-research run. Published to the feed when done.
Automated research opinion, published as-is on Aug 14, 2026. Not personalised advice. Figures use end-of-day closes.