Yes — but only in small size.
Thesis
Bull case
A 48%-growing, 136%-NDR software business with 85% gross margins is trading at roughly half the revenue multiple of its growth cohort because of an extreme IPO hangover and temporary margin anxiety. AI monetization is just beginning (first full quarter in Q2; usage-based revenue ramps through 2027), gross margin is already inflecting up, estimates are rising, and the September selloff is driven by finite mechanical supply (lockup, insider plans) rather than demand deterioration. As supply clears and Q3 confirms margins, the multiple normalizes toward peers — 10x FY27 sales alone implies ~$18B EV versus ~$10.8B today. Russell inclusion, elevated short interest, and potential Canva IPO chatter (re-rating the category) are accelerants.
Bear case
The 'cheap' EV/sales screen is an illusion: on earnings, FIG trades at ~67x FY27 consensus EPS, GAAP losses are enormous, and SBC dilution from RSU overhang will persist for years. The market's margin skepticism is rational — management is cutting AI credit prices 50% to buy volume, AI app builders (Lovable, v0, Cursor) are compressing the design-to-code workflow that is Figma's moat, and insiders with the best information are selling into every rally. FY27 consensus implies deceleration to ~24% growth; if AI costs keep outpacing AI revenue, even that is optimistic, and a 30% grower with sub-10% margins deserves a mid-single-digit sales multiple — meaning fair value could be below today's price. In a 75%-vol stock, being wrong is expensive.
What would change our mind
- Q3 2026 revenue misses the $373M low end of guidance or FY26 revenue guide is cut — would break the 'fundamentals intact' premise
- FY26 non-GAAP operating income guidance reduced below $125M or Q3 operating margin falls materially below ~9% — confirms the market's margin fear and removes the re-rating catalyst
- Net dollar retention drops meaningfully below ~130% — first hard evidence of competitive displacement
- FY27 consensus revenue revisions turn negative — would end the 'estimates rising while price falls' divergence that anchors the thesis
- Continued heavy insider selling into Q4 with no signs of abatement — signals informed holders see limited upside at these levels
Since publication vs SPY · closed horizons are frozen
The full research everything the view rests on
Direct answer to the question asked
Where the edge would come from
What the price assumes
At ~$24 the market appears to price FIG as a broken IPO with structurally capped margins: it assigns a below-peer revenue multiple despite top-decile growth, implying skepticism that the 9-10% non-GAAP operating margin guide survives AI infrastructure spending, and that FY27 consensus ($1.82B revenue, $0.36 EPS, implying deceleration to ~24% growth) is achievable. The ~16% after-hours drop on a beat-and-raise Q2 shows the marginal seller is pricing margin risk, not growth risk.
Why the market may be wrong
Two ways. First, the margin pessimism may be mistimed: Q2 was the first full quarter of AI monetization and gross margin actually improved 2.5pts to 85%; management says usage-based AI pricing (launched March) contributes 'later in 2026 and into 2027,' meaning the revenue offset to AI costs hasn't fully landed yet while the costs have. Second, the September selling pressure is substantially mechanical — lockup tranche release, pre-arranged insider sales, post-rally digestion — not new information about demand; NDR of 136% directly contradicts the displacement narrative from AI app builders.
The one thing to watch
The variable to watch is not revenue growth — it's whether non-GAAP operating margin holds the guided ~9% floor through the AI spend cycle. FY27 consensus already assumes growth decelerates to ~24%, so growth disappointment is largely priced; what is NOT priced is margin leverage. If Q3 shows operating margin at or above ~10% while AI credit revenue ramps, the market must re-rate the stock from 'broken IPO' toward the 10-13x peer band (implying 40-70% upside on sales multiple alone); if margin slips below the maintained $125-135M FY guide, the cheap-looking EV/sales is a value trap on a structurally lower-margin business.
Key evidence (9)
- Q2 2026 (reported Aug 5, 2026): revenue $370M, +48% y/y; gross margin 85% (+2.5pts q/q); operating income $36M (10% margin); NDR 136% [T1 SEC Q2 press release]
- FY26 revenue guidance raised ~$40M to $1.463-1.467B (+39%); FY26 non-GAAP operating income guidance maintained at $125-135M (~9% margin) [T1/earnings materials]
- Consensus as of Sep 14, 2026 (14 analysts): FY26 $1.47B rev / $0.29 EPS; FY27 $1.82B / $0.36 EPS; revisions rising over trailing 3 months [T4 Yahoo/stockanalysis — treat as approximate]
- Stock fell ~16% after hours on the Q2 beat-and-raise; Reuters attributed the reaction to rising AI and Config marketing costs pressuring margins [T2 Reuters]
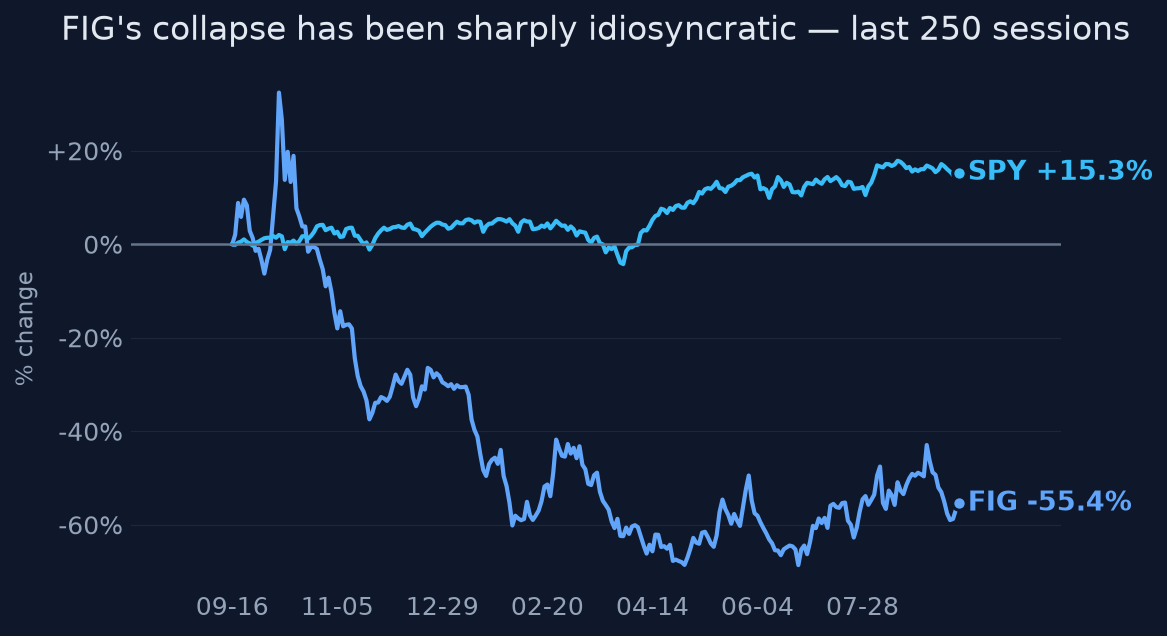
- Price/volatility: -57% over 1y, -66% from 52w high, max drawdown -76%, but +29% over 3 months and +42% off the 52w low; realized vol ~71-78% annualized; 60d correlation to SPY 0.04 (moves are idiosyncratic) [computed price data]
- Industry reference: 30-40% growth software cohort trades ~10-13x EV/NTM sales (Sep 2026 dataset) vs FIG at roughly 6-7x estimated [T4 multiples.vc — methodology unverified]
- Insider selling in Aug-Sep 2026 (pre-arranged plans) and an August lockup tranche release cited as supply overhang; short interest ~8.6-12.7% of float [T4 — moderately sourced, not confirmed via primary filings in this bundle]
- FY2025 GAAP net loss of $1.25B (largely IPO-related SBC); EPS -$3.71 [T1 SEC XBRL]
- Figma Make credit pricing cut ~50% to drive volume (Goldman conference, Sep 8, 2026); AI usage-based pricing launched March, contribution expected later 2026 into 2027 [T4 transcripts]
Catalysts and risks
Catalysts
- Q3 2026 earnings (~November 2026): revenue vs. $373-375M guide and, critically, operating margin trajectory vs. the $125-135M FY non-GAAP guide
- Evidence of AI credit/usage-based revenue ramp in reported metrics or management commentary through late 2026
- Cessation or continuation of insider selling after the August lockup tranche; any further unlock dates
- Potential Canva IPO filing — would re-rate the design-software category and reprice FIG as the public comp
- Possible index/ETF flows and short-covering given 8.6-12.7% short interest
- Any M&A or competitive moves from Adobe or AI app builders (Lovable, v0, Cursor) targeting design workflows
Risks
- Supply overhang: remaining lockup/insider selling could cap rallies for quarters regardless of fundamentals
- Margin guide cut: if AI infrastructure costs force FY26 non-GAAP operating income below $125M, the core 'margin skepticism is overdone' thesis fails
- Multiple compression continues: 67x FY27 EPS offers no valuation floor if growth software sentiment sours
- AI displacement: app builders compressing design-to-prototype workflows is an unquantifiable but real long-term threat
- Extreme volatility (~75% annualized, worst 5% days ≈ -8%): position sizing errors are costly even if directionally right
- Data-quality risk: peer multiple band, short interest, and insider-selling details rest on T4 sources, not primary filings
What to watch
- Q3 print (~Nov 2026): operating margin vs. the maintained $125-135M FY guide — the single most decisive data point
- Form 4 filings cadence: whether insider selling decelerates post-lockup
- NDR disclosure each quarter; 136% is the anti-displacement proof point
- Any disclosure of AI/usage-based revenue contribution (management flagged 'later in 2026 into 2027')
- FY27 consensus revision direction (currently $1.82B / $0.36, rising)
- Canva IPO developments and Adobe competitive announcements
- Short interest trend from the ~8.6-12.7% level
Market snapshot when the call was made 2026-09-14
Price
| Return 1w | -0.9% |
| Return 1m | -9.3% |
| Return 3m | +29.0% |
| Return 6m | -8.1% |
| Return 1y | -57.3% |
| From 52-week high | -66.4% |
| Realized vol, 20d | 71% |
| SPY 3m / 1y | +2.6% / +15.7% |
| QQQ 3m / 1y | -1.7% / +21.4% |
Technicals
FIG technicals as of 2026-09-14: last close $23.91; 20d SMA 25.86 (bullish); 50d SMA 24.52; 12d EMA 24.42; 26d EMA 24.92; RSI 14 37.8 (balanced); 20d vol 72.2%; volume x1.0 vs 20d avg
Sources (23 · T1 = primary filings)
- T4https://www.investing.com/news/transcripts/figma-at-goldman-sachs-communacopia--technology-conference-2026-ai-…
- T4https://www.fool.com/earnings/call-transcripts/2026/05/15/figma-fig-q1-2026-earnings-call-transcript/
- T4https://www.fool.com/earnings/call-transcripts/2026/08/12/figma-fig-q2-2026-earnings-call-transcript/
- T4https://finance.yahoo.com/quote/FIG/earnings/FIG-Q2-2026-earnings_call-669452.html
- T4https://finance.yahoo.com/quote/FIG/earnings/FIG-Q1-2026-earnings_call-559416.html/
- T4https://www.fool.com/earnings/call-transcripts/2026/02/18/figma-fig-q4-2025-earnings-call-transcript/
- T4https://id.investing.com/news/transcripts/figma-di-konferensi-goldman-sachs-communacopia--technology-2026-doro…
- T4https://www.investing.com/news/transcripts/earnings-call-transcript-figma-beats-q2-2026-estimates-but-stock-fa…
- T4https://www.theglobeandmail.com/investing/markets/stocks/FIG/pressreleases/3818169/figma-fig-q2-2026-earnings-…
- T4https://finance.yahoo.com/quote/1S2.DU/earnings/1S2.DU-Q2-2026-earnings_call-669452.html
- T1https://www.sec.gov/Archives/edgar/data/1579878/000162828026035087/q126pressrelease.htm
- T1https://www.sec.gov/Archives/edgar/data/1579878/000162828026053331/q226pressrelease.htm
- T4https://www.investing.com/news/transcripts/earnings-call-transcript-figmas-q1-2026-beats-expectations-with-str…
- T4https://finance.yahoo.com/quote/1FIG.MI/earnings/1FIG.MI-Q2-2026-earnings_call-669452.html/
- T1https://s206.q4cdn.com/973901332/files/doc_financials/2026/q1/Figma-Q1-2026-Prepared-Remarks.pdf
- T4https://multiples.vc/insights/software-saas-valuation-multiples
- T4https://finance.yahoo.com/news/figma-raises-1-2-billion-223506517.html
- T2https://www.reuters.com/company/figma-inc/
- T2https://www.reuters.com/info-pages/transcript/4b9c0122-a1f6-11f1-ac9c-db54ca8afa31/
- T2https://www.reuters.com/markets/companies/FIG.N/
- T4https://www.saastr.com/canva-crosses-a-stunning-4b-arr-but-what-would-it-be-worth-today/
- T2https://www.reuters.com/business/figma-targets-188-billion-valuation-us-ipo-after-bumping-up-price-range-2025-…
- T3https://www.cnbc.com/2025/07/28/figma-raises-ipo-range-to-30-to-32-per-share.html
Earlier and later calls on FIG
- Sep 25, 2026Business strong; stock a speculative buy.Lean bullish
- Sep 8, 2026Yes — massively, but not cheaply.No clear edgeview changed
- Aug 23, 2026No clear edge at $27.No clear edgeview changed
- Aug 14, 2026Multiple compression, not deterioration.Lean bullish
Want a fresh look at FIG, or another name?
Queue a new deep-research run. Published to the feed when done.
Automated research opinion, published as-is on Sep 15, 2026. Not personalised advice. Figures use end-of-day closes.