Yes — massively, but not cheaply.
Thesis
Bull case
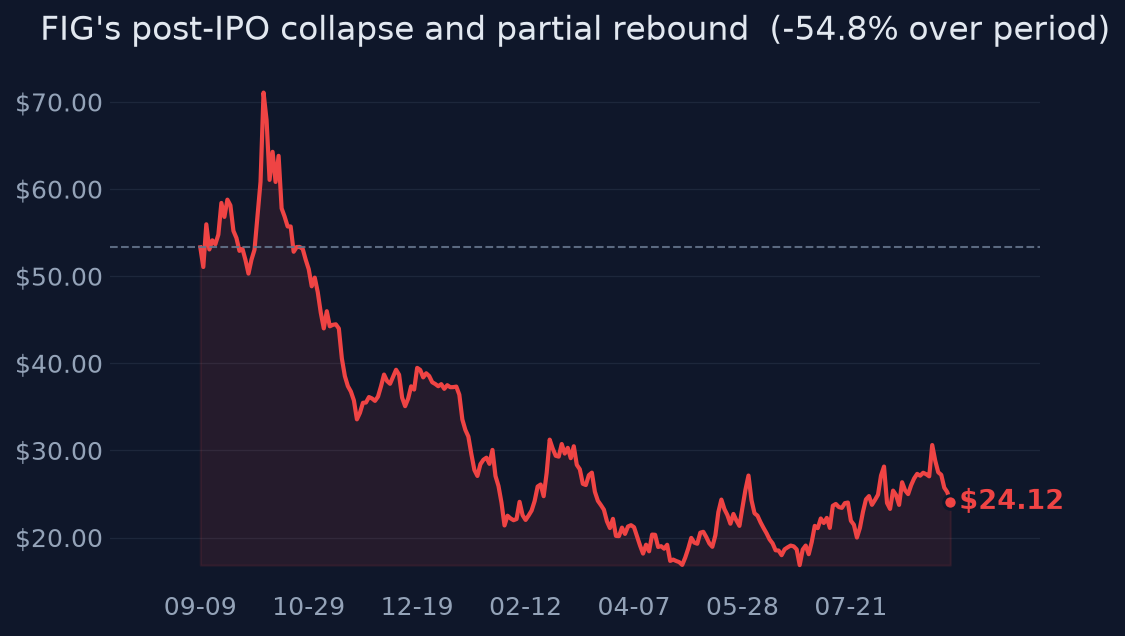
The business has never been stronger while the stock trades far below its post-IPO valuation extremes: 48% growth, 136% NDR, 82% gross margins, raised guidance, and positive revenue revisions — all at ~8x forward sales, versus the ~65x sales implied by the ~$68B peak market cap (though still above the ~5.6x it hit at the 2026 low of ~$16.9). If the Q3 'deceleration' proves to be conservative guidance sandbagging (a common post-IPO pattern) and AI features drive seat expansion and credit monetization as management claims, the next two earnings beats could force a re-rating back toward 10-12x sales (~$30-36/share). The stock has already bounced 43% off its lows and has been basing for 3 months.
Bear case
This is a repricing, not a dip: growth is decelerating (48% → guided 36%), AI costs are structurally compressing margins, AI-native design tools threaten the core franchise, lockup supply and insider selling continue, and the stock still trades at 86x forward earnings with ~80% realized vol. If Q3 prints at or below the 36% guide and gross margin slips further, the 8x sales multiple has room to compress toward mature-software levels (4-6x), implying $12-18. Last week's -16% on roughly average volume suggests the selling isn't exhausted.
What would change our mind
- If Q3 2026 revenue beats the ~36% guide AND gross margin stabilizes/expands, the bear/deceleration thesis is invalidated and the dip-dislocation reading gains support
- If revenue estimates get revised DOWN (they've been rising) or NDR drops materially below ~130%, the 'fundamentals intact' pillar breaks and the dip is deterioration
- If the stock breaks below the 2026 low (~$16.9) on heavy volume post-earnings, the basing thesis fails
Since publication vs SPY · closed horizons are frozen
The full research everything the view rests on
Direct answer to the question asked
Where the edge would come from
What the price assumes
At $24 (~$11.8B market cap), the market is pricing roughly 8x FY2026 guided sales (~$1.46B) and ~86x forward EPS — expectations of continued 30%+ growth with margin expansion delayed by AI infrastructure spend. The price no longer assumes hyper-growth perfection (as it did at $142), but it still assumes Figma successfully monetizes AI (Figma Make, AI credits) and defends share against AI-native design tools.
Why the market may be wrong
Consensus may be wrong in either direction on the deceleration question: bears extrapolate the Q3 guide (36%) into a structural slowdown driven by AI-native competition, yet NDR of 136% and a $40M guidance raise suggest expansion revenue is intact and management may be guiding conservatively post-IPO. Conversely, bulls treating this as 'just multiple compression' may underweight that AI costs are a structural, recurring margin headwind, not a one-time investment cycle — the 16% earnings-linked selloff on margin news shows the market is only beginning to price that.
The one thing to watch
The variable that matters now isn't revenue growth — it's whether AI spend is capex-like (one-time, margin-accretive later) or COGS-like (permanently lower structural margins). Figma's 82% gross margin is the core asset; if AI inference costs migrate into COGS as AI features become table stakes, the 8x sales multiple de-rates regardless of growth. Watch gross margin trajectory quarter to quarter, not the top line.
Key evidence (7)
- Price: $24.12 as of 2026-09-04, -72.4% below 52w high, +43.2% above 52w low, max 1y drawdown -80.7%, 1y return -55.8% vs SPY +18.7% [market data]
- FY2025 (SEC XBRL): revenue $1.056B, gross margin 82.4%, GAAP net loss -$1.25B (diluted EPS -$3.71, heavily IPO/SBC-driven) [T1 SEC]
- Q2 2026 (reported Aug 5, 2026): revenue $370M +48% y/y, adjusted EPS $0.08 beat, FY2026 guidance raised ~$40M to $1.463-1.467B, NDR 136% [T1 IR / T3 Morningstar]
- Q3 2026 guide implies ~36% growth — deceleration vs Q2's 48%; Reuters reported a 16% after-hours drop on AI-driven cost/margin compression despite the raise [T2 Reuters]
- Insider selling: GC Brendan Mulligan sold ~211.6K shares Aug 28 under a 10b5-1 plan plus Form 144 for ~109K shares filed ~Sep 3 [T1 SEC filings via T4 aggregators]
- Valuation: forward P/E ~86-89x on FY26 EPS consensus ~$0.24; recent observed forward P/E range ~66-141x; estimate revisions net positive for revenue over 3 months [T3 MarketWatch / T4 sources]
- Data caveat: one fundamentals pull showed stale FY26 revenue consensus of ~$1.30B vs company guidance of $1.46B — treat guidance as authoritative
Catalysts and risks
Catalysts
- Q3 2026 earnings (~November 2026): the deceleration guide (~36%) is the key test — a beat vs. guide reframes the narrative
- Quarterly gross margin prints: evidence on whether AI costs are one-time or structural
- Further lockup expiry tranches and insider Form 144/Form 4 filings
- AI product monetization metrics (Figma Make adoption, AI credit revenue disclosure)
- Competitive moves from AI-native design tools and Adobe's response
Risks
- Growth deceleration proves structural rather than conservative guidance
- AI infrastructure costs permanently impair the 82% gross margin profile
- Residual lockup/insider supply overhang caps rallies
- AI-native competitors erode Figma's design-tool moat faster than expected
- Extreme volatility (80%+ annualized) makes position sizing difficult and 3-6 month outcomes near-random
- Evidence residue: timing of the most recent -16% weekly move is weakly sourced — may reflect items not captured in this bundle
What to watch
- Gross margin trajectory each quarter — the single most informative line item
- Q3 print vs the 36% guide; magnitude of any beat
- NDR trend (136% last reported)
- Form 144/Form 4 cadence from insiders beyond scheduled 10b5-1 sales
- Analyst estimate revision direction — currently mildly positive; a flip to negative would be a red flag
- Volume on down-days vs up-days to gauge whether distribution is exhausted
Market snapshot when the call was made 2026-09-04
Price
| Return 1w | -16.3% |
| Return 1m | +0.6% |
| Return 3m | +10.9% |
| Return 6m | -17.1% |
| Return 1y | -55.8% |
| From 52-week high | -72.4% |
| Realized vol, 20d | 83.5% |
| SPY 3m / 1y | +4.4% / +18.6% |
| QQQ 3m / 1y | +2.0% / +25.0% |
Technicals
FIG technicals as of 2026-09-04: last close $24.12; 20d SMA 26.45 (bullish); 50d SMA 24.17; 12d EMA 26.38; 26d EMA 25.87; RSI 14 46.7 (balanced); 20d vol 79.6%; volume x1.1 vs 20d avg
Verifier notes REVISE · opinion revised once
Unsupported claims
- Bull case claims the stock trades 'at ~8x forward sales, the low end of its post-IPO range.' This is contradicted by the evidence itself: the stock is 43% above its 52-week low (~$16.9 per the planner digest), and at that low the market cap (~$8.2B on ~487M shares implied by $11.76B / $24.12) against FY26 guidance of ~$1.46B implies roughly 5.6x sales — meaningfully below today's 8x. The evidence bundle contains no historical price/sales range to support 'low end of the range,' and the computable figures cut against it.
Internal inconsistencies
- Bull case says 'The stock already bottomed 43% lower' — the 43.2% figure in the evidence is the percentage the current price sits ABOVE the 52-week low, not how far below the current price the low was (the low was ~30% below $24.12). The number is inverted relative to the source data, and it clashes with the same opinion's key_evidence line, which states the 43% correctly.
Corrections applied
- In bull_case, replace 'all at ~8x forward sales, the low end of its post-IPO range' with a defensible version, e.g. 'all at ~8x forward sales — far below the ~65x sales implied by the ~$68B peak market cap, though still above the ~5.6x it hit at the 2026 low' — or simply drop the range claim.
- In bull_case, fix 'The stock already bottomed 43% lower' to 'The stock has already bounced 43% off its lows' (or 'bottomed ~30% below current levels') to match the market data as used elsewhere in the opinion.
Sources (16 · T1 = primary filings)
- T4https://www.theglobeandmail.com/investing/markets/stocks/FIG/pressreleases/3818169/figma-fig-q2-2026-earnings-…
- T4https://finance.yahoo.com/quote/FIG/earnings/FIG-Q2-2026-earnings_call-669452.html
- T4https://finance.yahoo.com/markets/stocks/articles/figma-q2-2026-earnings-beat-140019235.html
- T4https://finance.yahoo.com/quote/1S2.DU/earnings/1S2.DU-Q2-2026-earnings_call-669452.html/
- T4https://finance.yahoo.com/quote/1FIG.MI/earnings/1FIG.MI-Q2-2026-earnings_call-669452.html/
- T4https://theoutpost.ai/news-story/figma-s-post-ipo-earnings-debut-ai-focus-amidst-stock-plunge-19867/
- T4https://quartr.com/companies/figma-inc_20892
- T2https://www.reuters.com/markets/companies/FIG.N/
- T4https://www.stocktitan.net/sec-filings/FIG/144-figma-inc-sec-filing-442f5a7f26fc.html
- T4https://www.fool.com/coverage/filings/2026/09/02/figma-general-counsel-sells-211-599-shares-for-usd6-3-million…
- T4https://www.stocktitan.net/sec-filings/FIG/
- T1https://investor.figma.com/financials/sec-filings/default.aspx
- T4https://www.tikr.com/blog/figma-fig-stock-drop-ai-competitors
- T4https://www.secform4.com/insider-trading/1579878.htm
- T2https://www.reuters.com/company/figma-inc/
- T4https://www.stocktitan.net/sec-filings/FIG/form-4-figma-inc-insider-trading-activity-09b7490efe60.html
Earlier and later calls on FIG
- Sep 25, 2026Business strong; stock a speculative buy.Lean bullishview changed
- Sep 15, 2026Yes — but only in small size.Lean bullishview changed
- Aug 23, 2026No clear edge at $27.No clear edge
- Aug 14, 2026Multiple compression, not deterioration.Lean bullishview changed
Want a fresh look at FIG, or another name?
Queue a new deep-research run. Published to the feed when done.
Automated research opinion, published as-is on Sep 8, 2026. Not personalised advice. Figures use end-of-day closes.