Momentum trap — timing trap, not value trap.
Thesis
Bull case
The selloff has fully discounted the bad news: at 17.6x forward earnings with a 3.2% yield from a 50-year Dividend King and ~4% total shareholder yield, downside is cushioned. Q2's problems were self-identified execution failures (value messaging, restaurant complexity), the 'McDonald's Next' retraining of 2M+ workers began October 5, beverage launches are outperforming, and marketing is repositioned through 2027 — if Q3 shows even flat-to-slightly-positive US comps, the stock re-rates toward its historical 18.5-21x range (~$240-280 on current estimates), and the November print becomes a clearing event.
Bear case
MCD is losing the value war structurally, not cyclically: its low-income customer base is pulling back hardest, years of price increases eroded its affordability edge, and peers (Taco Bell +7% SSS, Starbucks +6.5% guidance) prove share is being taken, not just demand shrinking. Negative comp guidance for Q3, 20:1 negative FY27 revision breadth, an $8.5B franchisee-support burden (weakly sourced), and the delayed 50k-store target suggest estimate cuts continue into 2027 — in which case 17.6x is a value illusion and the stock retests and breaks the $229 low.
What would change our mind
- Q3 US comps print at or above ~+1% with management guiding Q4 positively — the 'pre-signaled weakness' thesis fails and the bounce becomes a bottom
- FY27 EPS revision breadth flips positive (more raises than cuts) within 30 days post-earnings
- Price reclaims and holds the 50d SMA ($251.8) post-earnings on estimate confirmation — that would validate the technical signal
- For the bull case: a break below $229 on heavy volume with further FY26 estimate cuts confirms the downtrend
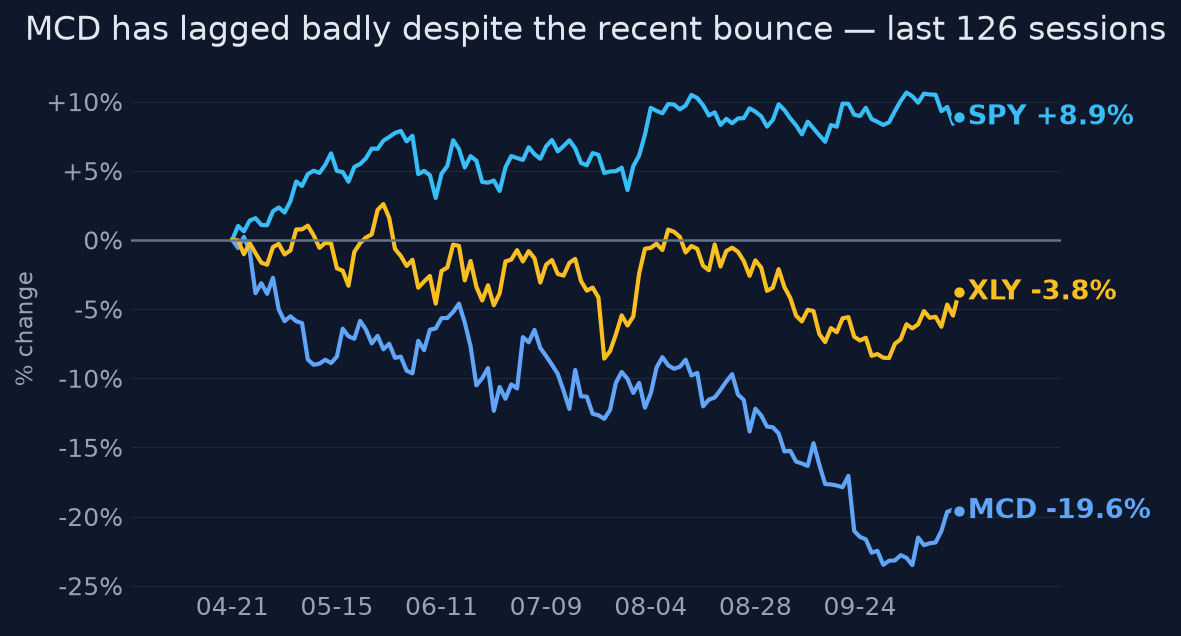
Since publication vs SPY · closed horizons are frozen
The full research everything the view rests on
Direct answer to the question asked
Where the edge would come from
What the price assumes
At ~17.6x FY26 consensus EPS of ~$12.88-12.90, the market prices MCD as a stable defensive compounder with modest growth; the bounce suggests some investors believe the execution problems are self-diagnosed and fixable, and that the yield floor holds.
Why the market may be wrong
The bounce assumes Q3 confirms stabilization, but the pre-signals (MS comp guidance, October target pile-on from Bernstein/Guggenheim/Wells Fargo/KeyBanc, negative revision breadth) point the other way. If Q3 US comps print negative and FY27 estimates keep falling, a 17.6x multiple on falling E is not cheap — the 'floor' re-rates lower. Conversely, bears may underestimate how much bad news is already in the price at 5% above the 52-week low.
The one thing to watch
The variable that matters is not the price pattern but the estimate-revisions-to-price divergence: in the 30 days before a reportedly pre-signaled negative Q3, FY27 EPS saw 20 cuts versus 1 raise while the stock rallied 3% — one of these resolves at the November 4 print, and for a momentum signal to be valid, revisions must confirm price; here they do the opposite.
Key evidence (7)
- Price action [computed from daily history, 2026-10-20]: -20.5% 1y, -20.9% 6m, 28.9% below 52w high, 5.1% above 52w low; 1y Sharpe ≈ -1.18; 20d vol at 87th percentile; below 50d SMA ($251.8), trend 'bearish', RSI 69
- Q2 2026 results (Aug 4, 2026, company release/transcript): adj EPS $3.38 beat ~$3.33, revenue $7.1B missed, US comps +0.8% below expectations; management attributed ~2/3 of shortfall to value-execution issues
- Estimate momentum [Yahoo/MarketWatch panels, Oct 19-20, 2026]: FY26 EPS cut ~0.4% over 3 months to ~$12.88; FY27 20 downward vs 1 upward revision in 30 days
- October analyst cuts: Bernstein $295→$250, Guggenheim $290→$250, Wells Fargo $300→$270, KeyBanc $305→$280; Morgan Stanley ~$297 citing slightly negative Q3 US comp guidance (T4 sourcing)
- Q3 2026 earnings scheduled November 4, 2026, 8:30am ET call
- Industry [Reuters, Aug 2026; Placer.ai]: US QSR visits -1.3% YTD; 'cheap deals no longer do the trick'; Taco Bell SSS +7%, Starbucks guiding ≥+6.5% US comps — MCD is losing the value war to executing peers
- Valuation/yield: ~17.6x forward P/E (Oct 16) vs cited ~18.5-21.4x historical range (T4, treat cautiously); ~3.2% dividend yield, 50 consecutive increases, ~1.25% buyback yield
Catalysts and risks
Catalysts
- Q3 2026 earnings November 4, 2026 (8:30am ET) — US comp print vs reportedly negative guidance; FY26/FY27 estimate reset
- Q4 2026 report ~February 9, 2027 (EPS est $3.32)
- Evidence of 'McDonald's Next' retraining (started Oct 5) translating into Q4 US traffic
- FY27 marketing repositioning and McValue performance updates
- Any primary-source disclosure on franchisee economics/support costs
Risks
- Q3 US comps print negative, confirming Morgan Stanley's pre-signal — gap-down risk in an 87th-percentile vol regime
- FY27 consensus ($13.76-13.78) keeps falling, compressing the E while the P/E floor holds
- Value war escalates, diluting franchisee margins and requiring more support spending
- Low-income consumer deteriorates further industry-wide
- Key claims (MS comp guidance, historical P/E range, franchisee support plan) rest on T4 sources and could be wrong in either direction
What to watch
- Nov 4: US same-store sales vs the 'slightly negative' pre-signal, and FY27 consensus direction in the following week
- Whether price holds the $229.30 52-week low on any disappointment — that level is the line between 'trap with floor' and breakdown
- Estimate revision breadth (raises vs cuts) as the confirmation variable for any scan signal
- Q4 channel checks / Placer.ai traffic for evidence the Oct 5 retraining program is working
- Franchisee health disclosures in the next 10-Q
Market snapshot when the call was made 2026-10-19
Price
| Return 1w | +3.0% |
| Return 1m | -2.2% |
| Return 3m | -8.1% |
| Return 6m | -20.9% |
| Return 1y | -20.5% |
| From 52-week high | -28.9% |
| Realized vol, 20d | 23.3% |
| SPY 3m / 1y | +2.4% / +16.0% |
| QQQ 3m / 1y | +1.3% / +19.7% |
Technicals
MCD technicals as of 2026-10-19: last close $242.67; 20d SMA 236.54 (bearish); 50d SMA 251.83; 12d EMA 238.80; 26d EMA 241.65; RSI 14 68.9 (balanced); 20d vol 22.7%; volume x0.8 vs 20d avg
Next earnings: 2027-02-09 AMC
Sources (24 · T1 = primary filings)
- T4https://www.perplexity.ai/finance/MCD?comparing=MCD,DNUT,WEN,PTLO,SHAK,EAT
- T4https://www.perplexity.ai/finance/MCD?comparing=MCD,CPG.L,2280.SR,DASH,6013.SR,9630.SR
- T4https://quartr.com/companies/mcdonald-s-corporation_5595
- T4https://www.marketbeat.com/earnings/reports/2026-11-4-mcdonalds-co-stock/
- T4https://www.perplexity.ai/finance/MCD?comparing=MCD,CPG.L,9630.SR,2280.SR,DASH,6013.SR
- T4https://www.marketbeat.com/stocks/NYSE/MCD/
- T4https://www.perplexity.ai/finance/MCD?comparing=MCD,3563.T,YUM,3397.T,8153.T,3387.T
- T4https://www.investing.com/news/analyst-ratings/wells-fargo-cuts-mcdonalds-stock-price-target-on-franchisee-dea…
- T4https://finance.yahoo.com/news/restaurant-brands-international-gets-lift-173200618.html
- T4https://www.matterfact.com/newsletter/2026-10-05-qsr-value-wars-mcdonalds-ai-pricing-franchisees-hot-seat
- T4https://www.marketbeat.com/earnings/reports/2026-10-29-restaurant-brands-international-inc-stock/
- T2https://www.reuters.com/business/mcdonalds-rivals-cheap-deals-no-longer-do-trick-2026-08-11/
- T4https://theprint.in/feature/american-fast-food-chains-are-in-trouble-consumers-are-not-spending/3013702/
- T4https://business.bofa.com/en-us/content/restaurant-industry-report.html
- T4https://investors.yum.com/news-events/financial-releases/
- T2https://www.reuters.com/business/mcdonalds-misses-us-sales-growth-target-value-push-fails-lift-demand-2026-05-…
- T4https://www.moneycontrol.com/us-markets/stockpricequote/mcdonalds/MCD
- T4https://finance.yahoo.com/markets/stocks/articles/mcdonald-stock-offers-juicy-dividend-233002294.html
- T4https://www.seattletimes.com/business/mcdonalds-promotions-lure-diners-despite-higher-menu-prices-and-revenue-…
- T4https://finance.yahoo.com/quote/MCD/history/
- T4https://robinhood.com/us/en/stocks/MCD/
- T3https://www.marketwatch.com/investing/stock/mcd
- T4https://ca.finance.yahoo.com/quote/MCD/
- T4https://www.fidelity.co.uk/factsheet-data/factsheet/US5801351017-mcdonalds-corporation/dividends
Earlier and later calls on MCD
- Oct 9, 2026Cheap, but not yet cleared.Lean bullishview changed
- Oct 6, 2026Oversold reset — cautiously attractive.Lean bullishview changed
- Oct 6, 2026Oversold derating — lean bullish into Q3.Lean bullishview changed
- Sep 23, 2026Dipped, yes. Undervalued, probably.Lean bullishview changed
- Sep 23, 2026Washed out, not broken — lean bullish.Lean bullishview changed
- Sep 6, 2026Yes, cautiously — it's a show-me buy.Lean bullishview changed
Want a fresh look at MCD, or another name?
Queue a new deep-research run. Published to the feed when done.
Automated research opinion, published as-is on Oct 20, 2026. Not personalised advice. Figures use end-of-day closes.