Cheap, but not yet cleared.
Thesis
Bull case
~17x forward on a franchise model that grew EPS 4.9% in FY2025 with consensus implying ~8% growth in FY2026 ($12.89 vs $11.95), holds a 46% operating margin, is adding ~10,000 net units by 2027, and has 220M loyalty users (+13%). The de-rating is ~35pts vs SPY on events whose cash impact is either modest (comps miss of ~0.3pts), decade-spread and already embedded in guidance (the $8.5B), or contradicted by available data (GLP-1). Peers holding up far better prove the sector multiple isn't broken, so a US value-execution stabilization at Q3 — which Q4 2025's beat showed is achievable — plus continued buybacks could drive a re-rating toward the low-20s multiple, implying 25-40% upside on FY2027 EPS of ~$13.77 with limited fundamental downside given the defensive demand base.
Bear case
Management itself guided to flat industry traffic and admitted value execution failed — twice in three quarters (Q1 warning, Q2 miss) after Q4 2025's win, so momentum is negative, not stable. The $8.5B rent relief is an implicit admission that franchisee economics broke at current rent/royalty loads, and a model whose health depends on franchisee P&Ls is now subsidizing them while corporate targets 50%+ margins — a value-chain split that may force more support or slower royalty growth than consensus models. Revisions are running 11-13 down vs 2 up into the print, and if Q3 misses on comps again, $12.89 FY26 and $13.77 FY27 come down, meaning today's 17x is really 18-19x on realistic numbers with a negative revisions cycle just starting — the classic value-trap setup, as CMG's parallel -20% shows consumer weakness isn't purely an execution excuse.
What would change our mind
- FY2027 consensus EPS falls materially below ~$13.30 (i.e., >3-4% cut) after the Q3 print — that converts the drawdown from multiple compression into earnings deterioration
- Q3 US comps negative with management guiding to further franchisee support beyond the announced $8.5B
- Credible quantified evidence emerges that GLP-1 adoption is reducing QSR traffic/basket size at scale
- Franchisee-level data (unit economics, closures, transfer values) show systemic distress despite the support package
- Stock de-rates below ~15x forward with estimates intact — at that point the market is signaling information the public evidence bundle doesn't contain
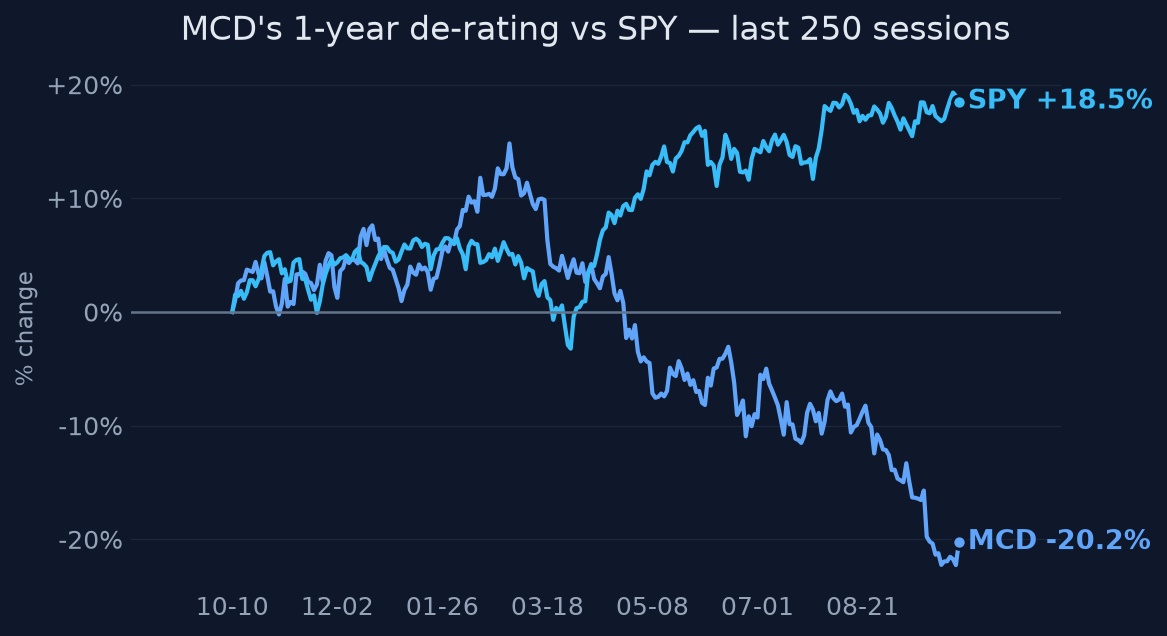
Since publication vs SPY · closed horizons are frozen
The full research everything the view rests on
Direct answer to the question asked
Where the edge would come from
What the price assumes
At ~17x forward FY2026 EPS, the market is pricing MCD as an ex-growth staple facing sustained estimate cuts — implying either that consensus $12.89/$13.77 is too high, or that the durable ~20x+ premium the market historically paid for the franchise model is permanently impaired by strained franchisee economics, flat industry traffic, and GLP-1 demand risk. Peers (YUM -2.5% 1y, QSR +5.1% 1y) trading far better indicates the market sees this as MCD-specific execution failure, not a sector de-rating.
Why the market may be wrong
The selloff's magnitude is inconsistent with the measured fundamental damage: FY2025 revenue +3.7%, EPS +4.9%, record operating margin; and Q2 2026 systemwide sales +5% with loyalty users +13% to ~220M. The two biggest narrative drivers look overstated on the evidence: the $8.5B franchisee support is spread over a decade (~$5B by 2030) and is already embedded in the company's own mid-to-high-80s% FCF conversion and low-to-mid-50s% margin targets for 2030; and the GLP-1 demand-collapse story is contradicted by the available industry data (a 2026 National Restaurant Association survey found GLP-1 users buy restaurant food MORE often, 7.6 vs 5.1x/week, with mix shifting away from sides — though this is secondhand [T4] and should be treated as medium-quality). If consensus is wrong, it is wrong by pricing a narrative break where the data show only an execution stumble.
The one thing to watch
The variable to watch is not Q3 comps — it is estimate-revision breadth in the 30-60 days after the Oct 22 print. The entire bear case is currently carried by revisions momentum (FY26: 2 up / 11 down; FY27: 2 up / 13 down in the last 30 days). If FY2027 EPS estimates hold near $13.77 while the stock stays ~30% below its 52w high, this is provably multiple compression on an intact earnings base, and ~17x is a floor; if revisions keep cascading after Q3, the market was correctly front-running a franchise-model repricing and 17x is a value trap. The Q2 comps number itself is almost noise by comparison.
Key evidence (9)
- FY2025: revenue $26.885B (+3.7%), diluted EPS $11.95 (+4.9%), operating margin 46.1% — best of the 2021-25 series [SEC XBRL, T1]
- Q2 2026 (reported Aug 4, 2026): adj EPS $3.38 beat ~$3.32, but US comps +0.8% missed ~+1.06% consensus; global comps +1.3% vs +3.8% a year earlier; management admitted US value push 'did not resonate' [Reuters T2; MCD release]
- Sept 23, 2026 investor day: $8.5B franchisee support through 2036 (~$5B by 2030, rent relief + capital); stock fell up to 6.5% on the day; management warned industry traffic in key markets could stay flat [Reuters/Bloomberg T2]
- 2030 targets: ~10,000 net new units by 2027, ~2% systemwide sales growth from unit expansion, operating margin low-to-mid 50s%, FCF conversion mid-to-high 80s%; no standalone EPS growth target disclosed [Investor Day release; CNBC T3]
- Forward P/E ~17.0-17.9x as of Oct 1-8, 2026, vs ~27.6x in 2023 and far higher historically [Yahoo/StockAnalysis/Eulerpool — T4 aggregator data; direction reliable, exact figures weakly sourced]
- Estimate revisions, last 30 days: FY2026 EPS 2 up / 11 down; FY2027 2 up / 13 down [businessquant/Yahoo T4]
- Price/quant: -20.1% 1y, -23.5% 6m, 30.5% below 52w high, 2.6% above 52w low, max drawdown -32.3%, 20d vol at 90th percentile; 1y correlation to SPY ~0.01 (fully idiosyncratic); peers: YUM -2.5%, QSR +5.1%, CMG -20.2% 1y [computed from daily prices]
- GLP-1: no evidence of demand collapse; 2026 National Restaurant Association survey cited in coverage found GLP-1 users purchase restaurant food 7.6x/week vs 5.1x for non-users, with mix shifting from sides/snacks [ABC News T4 — secondhand, medium quality]; MCD adapting menus with protein/portion flexibility [Reuters/Bloomberg T2]
- Next earnings ~Oct 22, 2026; consensus ~$7.33B revenue / ~$3.40 EPS [Reuters T2]
Catalysts and risks
Catalysts
- Q3 2026 earnings ~Oct 22, 2026 (consensus ~$7.33B rev / ~$3.40 EPS) — US comps and value-execution commentary are the swing factors
- Estimate-revision direction in the 30-60 days following the print
- Any update on deployment pace/terms of the $8.5B franchisee support ($5B by 2030)
- US traffic/value-menu data points (monthly industry traffic, competing value launches from QSR/Wendy's)
- GLP-1 adoption data and any quantified restaurant-demand studies
- Commodity (beef) cost trajectory and any China/geopolitical developments — unverified this round
Risks
- Q3 US comps miss again, confirming the value platform isn't working and triggering another estimate-cut wave
- The $8.5B proves to be the first tranche of a larger franchisee bailout, compressing royalty/rent economics structurally
- Consumer weakness is genuinely industry-wide (CMG also -20%), so execution fixes don't restore traffic
- GLP-1 mix shift (fewer sides/snacks per visit) erodes check size even if traffic holds
- Beef/commodity inflation squeezes franchisee margins further, worsening the franchisee-health problem
- Historical P/E comparisons rest on T4 aggregator data — the 'decade-low multiple' claim is directionally sound but imprecisely sourced
What to watch
- Estimate-revision breadth (up vs down counts) for FY26/FY27 in the 30-60 days post-Q3 — the single highest-signal variable
- Q3 US comparable sales vs the ~+1% bar and management's value-execution commentary
- Any disclosure on franchisee economics: rent relief uptake, franchisee cash-flow margins, unit closures
- Peer US comps (YUM/Taco Bell, QSR/Burger King, Wendy's) to separate MCD-specific execution from industry demand
- GLP-1 penetration data and menu-mix evidence (attach rates on sides/beverages)
- Beef and labor cost trends into 2027
- Buyback pace — whether the company is defending the multiple with repurchases at these levels
Market snapshot when the call was made 2026-10-08
Price
| Return 1w | +2.2% |
| Return 1m | -6.5% |
| Return 3m | -13.7% |
| Return 6m | -23.5% |
| Return 1y | -20.1% |
| From 52-week high | -30.5% |
| Realized vol, 20d | 24.2% |
| SPY 3m / 1y | +2.5% / +15.7% |
| QQQ 3m / 1y | +3.0% / +23.7% |
Technicals
MCD technicals as of 2026-10-08: last close $236.90; 20d SMA 240.68 (bearish); 50d SMA 256.31; 12d EMA 236.06; 26d EMA 243.21; RSI 14 33.0 (balanced); 20d vol 24.0%; volume x1.7 vs 20d avg
Verifier notes REVISE · opinion revised once
Unsupported claims
- Bull case: 'a franchise model that grew EPS ~8% in FY2025' — the SEC XBRL evidence shows FY2025 diluted EPS of $11.95 vs $11.39 in FY2024, i.e. +4.9% (which the opinion itself states correctly in the answer and key_evidence). The ~8% figure in the evidence applies to FY2026 consensus ($12.89, +7.9% off $11.95), not to FY2025 actuals. This overstates trailing growth by ~60% in the core bull-case sentence.
Internal inconsistencies
- bull_case asserts FY2025 EPS growth of ~8% while the answer, thesis, and key_evidence all state FY2025 EPS grew 4.9% — the opinion contradicts itself on a basic fact.
- why_market_may_be_wrong lists 'systemwide sales +5%, loyalty users +13% to ~220M' inside a sentence framed as FY2025 results ('FY2025 revenue +3.7%, EPS +4.9%, record operating margin, systemwide sales +5%...'), but the evidence shows systemwide sales +5% (~$37B) and loyalty +13% to ~220M are Q2 2026 quarterly figures, not FY2025 annuals. Minor scoping error, but it misattributes the data period.
Corrections applied
- In bull_case, change 'grew EPS ~8% in FY2025' to either 'grew EPS ~5% in FY2025 with consensus implying ~8% growth in FY2026' or 'is expected to grow EPS ~8% in FY2026 per consensus ($12.89 vs $11.95)'.
- In why_market_may_be_wrong, rescope the trailing-data sentence, e.g.: 'FY2025 revenue +3.7%, EPS +4.9%, record operating margin; and Q2 2026 systemwide sales +5% with loyalty users +13% to ~220M.'
Sources (22 · T1 = primary filings)
- T1https://www.businesswire.com/news/home/20260729551438/en/Yum-Brands-Reports-Second-Quarter-Results
- T4https://fortune.com/company/yum-brands/earnings/q2-2026/
- T4https://scanx.trade/stock-market-news/companies/restaurant-brands-intl-q2fy26-results-adjusted-eps-rises-12-9-…
- T4https://finance.yahoo.com/quote/YUM.MX/earnings/YUM.MX-Q2-2026-earnings_call-656906.html
- T4https://www.linkedin.com/posts/yum-brands_yum-brands-q2-2026-results-activity-7488594309122818048-zBOl
- T4https://abcnews.com/US/weight-loss-drug-usage-grows-restaurants-offer-glp/story?id=135711648
- T3https://www.cnbc.com/2026/07/30/yum-brands-yum-q2-2026-earnings.html
- T4https://stockanalysis.com/stocks/qsr/transcripts/553912-q2-2026/
- T2https://www.reuters.com/business/mcdonalds-outlines-85-billion-plan-support-franchisees-2026-09-23/
- T2https://www.bloomberg.com/news/articles/2026-09-23/mcdonald-s-commits-8-5-billion-to-fend-off-fierce-competiti…
- T4https://www.investing.com/news/stock-market-news/mcdonalds-lays-out-2030-targets-with-margin-unit-growth-and-a…
- T4https://ca.investing.com/news/stock-market-news/mcdonalds-lays-out-2030-targets-with-margin-unit-growth-and-ai…
- T4https://uk.investing.com/news/stock-market-news/mcdonalds-lays-out-2030-targets-with-margin-unit-growth-and-ai…
- T4https://in.investing.com/news/stock-market-news/mcdonalds-lays-out-2030-targets-with-margin-unit-growth-and-ai…
- T4https://corporate.mcdonalds.com/content/dam/sites/corp/nfl/pdf/2026%20Investor%20Day%20Press%20Release.pdf
- T4https://www.fidelity.com/news/article/top-news/202609230802RTRSNEWSCOMBINED_KBN3V918N-OUSBS_1
- T4https://corporate.mcdonalds.com/corpmcd/our-stories/article/NEXT-growth-strategy-advances.html
- T3https://www.cnbc.com/2026/09/23/mcdonalds-investor-day-remodels-training-chicken-growth-plans.html
- T4https://finance.yahoo.com/markets/stocks/articles/mcdonald-sets-2030-margin-market-124325742.html
- T4https://finance.yahoo.com/markets/stocks/articles/mcdonalds-next-strategy-targets-chicken-180227251.html
- T2http://rmb.reuters.com/rmd/rss/item/tag:reuters.com,2026:newsml_MT1USDAYNETN91919787007?channel=nhm034
- T4https://finance.yahoo.com/markets/stocks/articles/mcdonalds-pledges-8-5-billion-124054879.html
Earlier and later calls on MCD
- Oct 20, 2026Momentum trap — timing trap, not value trap.Lean bearishview changed
- Oct 6, 2026Oversold reset — cautiously attractive.Lean bullish
- Oct 6, 2026Oversold derating — lean bullish into Q3.Lean bullish
- Sep 23, 2026Dipped, yes. Undervalued, probably.Lean bullish
- Sep 23, 2026Washed out, not broken — lean bullish.Lean bullish
- Sep 6, 2026Yes, cautiously — it's a show-me buy.Lean bullish
Want a fresh look at MCD, or another name?
Queue a new deep-research run. Published to the feed when done.
Automated research opinion, published as-is on Oct 9, 2026. Not personalised advice. Figures use end-of-day closes.