Washed out, not broken — lean bullish.
Thesis
Bull case
At a derived ~18.5x forward and a reported ~3.2% yield, MCD is priced as if its own guidance is false. The business is franchised, 46% operating margin, and still growing EPS; Q2's miss was execution, not demand collapse, and management's $8.5B franchisee package plus remodels/training directly targets the U.S. traffic problem. If Q3 U.S. comps inflect from +0.8% toward +2-3% — plausible given easy comparisons and new beverage platforms already outperforming expectations per management (chicken remains a 2030 share-gain target, not a current result) — revisions turn up, the Street's $13.95 FY27 number proves conservative against a low-double-digit algorithm, and re-rating to 21-22x on $13.95 implies ~$293-307, or ~23-29% upside from $238, within 6-12 months; the nearer ~$271 waypoint is 21x FY26 $12.92. Oversold technicals (RSI 20, capitulation-volume 52-week low) plus the reported dividend/buyback support limit downside, though the dividend confirmation is T4-only.
Bear case
The selloff is the market correctly pricing a structural traffic problem management can't fix with discounts: value promos stopped working industry-wide in 2026 [Reuters], 44% of low-income consumers are dining out less (eMarketer data), GLP-1 adoption hit 21% of households and is still climbing, and management admitted its own execution missteps after two straight years of value-war spending. The Investor Day algorithm is back-loaded (mid-teens EPS only by 2028) and the 2030 margin target requires 400-900bps of expansion while simultaneously spending $8.5B on franchisees and absorbing wage/beef inflation — the math leans on franchised mix shifts and G&A cuts that may not materialize. If Q3 U.S. comps stay near zero, FY27 estimates resume their drift down, and a 'cheap' 18.5x on falling estimates is a value trap; a break of the 52-week low on volume opens $210-220.
What would change our mind
- Q3 2026 U.S. comps come in flat-to-negative and management again blames execution without credible new actions — thesis of 'stabilization is enough' fails
- FY27 consensus EPS falls below ~$13.60 (i.e., the Street explicitly rejects the low-double-digit algorithm) while the stock holds ~18x — then it is expensive on real numbers, not cheap
- Any cut to franchisee economics guidance, a slowdown in buybacks, or dividend growth stalling materially below its historical rate — would break the capital-return floor underpinning the downside case (note: no specific historical dividend-growth rate is evidenced in this bundle; the condition is qualitative)
- Evidence that GLP-1 is causing >2-3% structural traffic decline at MCD specifically (vs. the current ~4-5% spending reduction among users industry-wide)
Since publication vs SPY · closed horizons are frozen
The full research everything the view rests on
Direct answer to the question asked
Where the edge would come from
What the price assumes
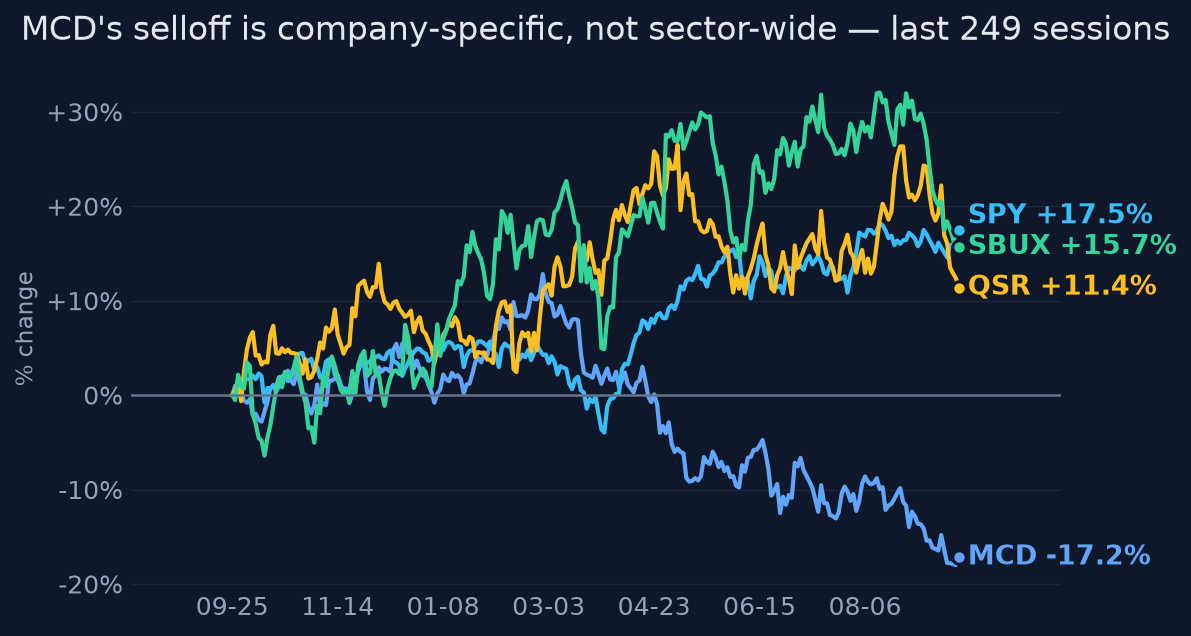
The price assumes near-term U.S. comps stay weak and that management's 2030 targets (low-to-mid-50% operating margin, mid-teens EPS growth by 2028) are aspirational rather than bankable — evidenced by the ~5% selloff on Investor Day itself and a string of pre-event target cuts (UBS, Citi, RBC, TD Cowen, Jefferies, Bernstein, Seaport). At ~18.5-19x forward with 99% idiosyncratic decline, the market has largely de-rated MCD from 'defensive compounder' to 'show-me story.'
Why the market may be wrong
Consensus FY27 EPS of $13.95 implies only ~8% growth, yet management guided low-double-digit EPS growth through 2027 via buybacks + operating profit growth + stable tax — the bar the stock must clear is management's own conservative near-term algorithm, not the 2030 vision. The franchisee support math (~$8.5B through 2036, claimed ~$100K/yr cash-flow benefit per average U.S. restaurant, ~4-year payback) directly addresses the franchisee-economics objection that has capped multiple expansion. Fundamentals have not deteriorated: FY25 operating margin 46.1% is the best in five years, Q2 adjusted EPS beat, and FX is now a ~$0.15 FY26 tailwind.
The one thing to watch
The variable to watch is not the 2030 targets or even the comps level — it is the direction of FY27 estimate revisions: consensus ($13.95, ~8% growth) already sits below management's stated low-double-digit algorithm, so if revisions merely stop falling after Q3 prints, the de-rating is mathematically overdone at ~18.5x even if U.S. traffic only stabilizes rather than re-accelerates. In other words, this is a stock priced for guidance to be a lie; it only needs guidance to be roughly true.
Key evidence (9)
- Price/technical: -26.6% below 52w high, 1% above 52w low, RSI 20 (oversold), volume 2.9x 20d average, -17.2% 1y vs SPY +16.5% (computed from daily price history, 2026-09-23)
- Fundamentals [T1 SEC XBRL]: FY2025 revenue $26.885B (+3.7%), diluted EPS $11.95, operating margin 46.1% — highest in the 2021-2025 series
- Q2 2026 (reported Aug 4, 2026): adjusted EPS $3.38 beat $3.34 consensus; revenue $7.099B missed $7.14B; global comps +1.3%, U.S. comps +0.8%; management cited U.S. execution below expectations and said new beverage launches outperformed expectations (company release/transcripts)
- Consensus [T2/T3 WSJ/MarketWatch, Sep 2026]: FY26 EPS $12.92 (down from $12.99 three months prior), FY27 EPS $13.95 (down from $14.19); forward P/E quoted ~18.7-19.2x; ~18.5x used here is derived arithmetic ($238.32 ÷ $12.92)
- Investor Day Sept 23, 2026 [T2 Reuters, T3 CNBC]: low-to-mid-50% operating margin target by 2030, mid-to-high-80% FCF conversion, unit growth adding ~2.5% to systemwide sales in 2027, ~$8.5B franchisee support through 2036; EPS algorithm of low-double-digit growth through 2027 and mid-teens by 2028; chicken/beverage category share gain of +1.5pt is a 2030 TARGET, not current performance; stock fell ~5% on the day
- Industry backdrop [T2 Reuters, Aug 2026]: U.S. QSR traffic flat-to-negative; value promos stopped driving traffic in 2026; Wendy's U.S. same-restaurant sales -7% vs Taco Bell +7%
- Low-income consumer stress: 44% of lower-income consumers dining out less — sourced from an eMarketer 2026 summary [T3/T4], NOT Reuters as previously tagged
- GLP-1 [T2 Reuters/PwC]: adoption 21% of U.S. households (May 2026, up from 9% Jan 2025); users spending ~4-5% less on fast food — real but secondary, showing up in menu mix more than aggregate demand
- Capital return: a quarterly dividend raise to $1.93 (~3.2% yield at $238) was reported around Investor Day, but this claim rests ONLY on T4 citations (ad-hoc-news, MarketBeat, 247wallst) in the evidence bundle — no T1/T2 confirmation available; treat the yield/capital-return-floor argument as hedged until confirmed
Catalysts and risks
Catalysts
- Q3 2026 earnings (expected late Oct/early Nov 2026): U.S. comp print is the single decisive data point for the 'urgent action' turnaround
- Post-Investor Day analyst revisions over the next 2-4 weeks: whether the Street marks FY27 EPS toward the low-double-digit algorithm or keeps cutting
- Monthly/quarterly industry traffic data and any update on McValue/beverage platform performance
- Confirmation (or not) of the reported $1.93 quarterly dividend via company IR/8-K — the current yield figure rests on T4 sources only
- GLP-1 adoption trajectory and any company-specific commentary on demand impact
- Franchisee reception signals to the NEXT plan economics (surveys, franchisee association commentary)
Risks
- Q3 U.S. comps disappoint again, confirming the traffic problem is structural and triggering another leg of estimate cuts
- Negative revision momentum (FY27 already cut $14.19→$13.95 in 3 months) persists, making the forward P/E deceptively cheap
- Value-war economics compress franchisee margins despite the support package, creating franchisee friction
- GLP-1 adoption compounds faster than expected, turning a secondary headwind into a primary one
- Macro consumer deterioration (44% of low-income consumers already dining out less, per eMarketer) broadens to middle-income cohorts
- The reported dividend raise is never confirmed by a primary source, weakening the capital-return-floor leg of the downside-limitation argument
- Technical risk: broken chart, 52-week-low proximity, and high-volume rejection can attract further momentum selling before fundamentals matter
What to watch
- Direction of FY27 EPS revisions in the 2-4 weeks post-Investor Day — the single most informative signal (thesis is falsifiable here)
- Q3 2026 U.S. comparable sales vs. the +0.8% Q2 base; anything ≥+2% validates stabilization
- Post-Investor Day analyst actions: does the KeyBanc $305 Overweight view gain followers or do the pre-event cutters (UBS, Citi, RBC, TD Cowen, Jefferies, Bernstein) cut again
- U.S. QSR industry traffic reads (e.g., Placer/Black Box-type data) and competitor prints — Wendy's distress vs. Taco Bell strength shows whether MCD's problem is share loss or category
- Beef and wage cost commentary for margin-path credibility toward the 2030 target
- Whether the reported $1.93 dividend is confirmed by company IR/SEC filing — it currently underpins the ~3.2% yield claim on T4 sourcing alone
- Whether the stock holds the ~$236-238 52-week-low zone on declining volume (base-building) vs. breaks it (trend continuation)
Market snapshot when the call was made 2026-09-23
Price
| Return 1w | -1.0% |
| Return 1m | -7.6% |
| Return 3m | -7.8% |
| Return 6m | -18.8% |
| Return 1y | -17.2% |
| From 52-week high | -26.6% |
| Realized vol, 20d | 18.3% |
| SPY 3m / 1y | +5.4% / +16.5% |
| QQQ 3m / 1y | +4.3% / +23.1% |
Technicals
MCD technicals as of 2026-09-23: last close $238.32; 20d SMA 254.99 (bearish); 50d SMA 263.81; 12d EMA 250.37; 26d EMA 256.24; RSI 14 20.0 (oversold); 20d vol 23.7%; volume x2.9 vs 20d avg
Verifier notes REVISE · opinion revised once
Unsupported claims
- Invalidation condition cites 'dividend growth stalling below historical ~7-8% cadence' — no figure for MCD's historical dividend growth cadence appears anywhere in the evidence bundle (only the current $1.93/quarter rate and ~3.2% yield are evidenced). The ~7-8% is a specific number introduced without support.
- Bull case claims 'new beverage/chicken platforms already outperforming' — evidence supports only beverage launches outperforming expectations (Q2 call commentary). For chicken, the evidence shows a 2030 *target* of +1.5pt category share gain, not current outperformance. The claim conflates a future target with present results.
Weakly sourced
- 'Quarterly dividend raised to $1.93 (~3.2% yield at $238)' — a load-bearing claim for the 'capital-return floor' thesis and one of the invalidation conditions, but in the evidence it rests only on T4 citations (ad-hoc-news item in the Investor Day search; 247wallst/MarketBeat in the selloff search). No T1/T2/T3 source in the bundle confirms the raise or the $1.93 figure.
- The 44% lower-income-consumers statistic is tagged '[T2 Reuters]' in key_evidence, but the evidence attributes it to an eMarketer summary, not Reuters — minor mis-tagging of the source for a stat used in both bear case and risks.
Internal inconsistencies
- Bull case states re-rating to 21-22x on $13.95 implies '$293-307 (~25-30% upside)' — the price targets are correct (21×13.95=$292.95; 22×13.95=$306.90) but the upside vs $238.32 computes to ~23-29%, not 25-30%. Minor overstatement of the low end; also note thesis separately says 21-22x implies '$270-300', which is a looser range (only reachable by mixing FY26/FY27 EPS bases) — the two target ranges should be reconciled or the EPS base stated.
- Answer and thesis use '~18.5x forward' while key_evidence cites '~18.7-19.2x' from the sources. 18.5x is derivable arithmetic ($238.32/$12.92 = 18.45x) so it is defensible, but the opinion should note it is a derived figure rather than the quoted source range.
Corrections applied
- Remove the '~7-8% cadence' figure from the invalidation condition, or rephrase as 'dividend growth stalling materially below its historical rate' without asserting an unevidenced number.
- Change 'new beverage/chicken platforms already outperforming' to 'new beverage platforms already outperforming expectations (per management), with chicken a 2030 share-gain target' — or drop chicken from the near-term comps-inflection rationale.
- Either source the $1.93 dividend raise with a T1/T2 citation before relying on it for the yield and capital-return-floor argument, or hedge the language ('reported dividend increase to $1.93').
- Fix the bull-case upside to '~23-29%' (or '~25%' at the midpoint), and align the thesis '$270-300' range with the bull case by stating the EPS base (e.g., 21x FY26 $12.92 ≈ $271; 21-22x FY27 $13.95 ≈ $293-307).
- Re-tag the 44% low-income-consumer stat to its actual source (eMarketer via industry search) rather than Reuters [T2].
Sources (32 · T1 = primary filings)
- T4https://247wallst.com/cards/a-second-straight-52-week-low-at-248-48-lands-the-same-day-mcd-price-extreme-01m2r…
- T3https://www.cnbc.com/quotes/MCD
- T2https://www.reuters.com/markets/companies/MCD.N/
- T4https://www.marketbeat.com/instant-alerts/price-mcdonalds-nyse-mcd-reaches-new-52-week-low-heres-why-2026-09-2…
- T4https://www.thefly.com/mcd
- T4https://www.ad-hoc-news.de/boerse/news/corporate-news/mcdonald-s-stock-heads-into-the-open-after-a-0-0-percent…
- T4https://in.investing.com/news/stock-market-news/mcdonalds-outlook-valuation-estimates-and-the-investor-day-tes…
- T4https://finance.yahoo.com/markets/stocks/articles/mcdonalds-investor-day-2026-plan-112848762.html
- T4https://quartr.com/events/mcdonald-s-corporation-mcd-investor-day-2026_3g5IhUQF
- T4https://uk.investing.com/news/stock-market-news/mcdonalds-lays-out-2030-targets-with-margin-unit-growth-and-ai…
- T3https://www.cnbc.com/amp/2026/09/23/mcdonalds-investor-day-remodels-training-chicken-growth-plans.html
- T4https://www.stocktitan.net/news/MCD/mc-donald-s-advances-next-strategy-to-become-first-choice-for-more-h281nk5…
- T4https://businessmodelanalyst.com/mcdonalds-investor-day-remodel-check-franchise-renewal/
- T4https://www.bnnbloomberg.ca/business/company-news/2026/09/23/mcdonalds-outlines-us85-billion-plan-to-support-f…
- T4https://stocknow.ai/en/calls/orr68crdoovfsi3euuzep8x9/mcd_investor-day-2026
- T4https://www.rte.ie/news/business/2026/0923/1592685-mcdonalds-85-billion-franchisee-support-plan/
- T2https://www.reuters.com/business/mcdonalds-rivals-cheap-deals-no-longer-do-trick-2026-08-11/
- T4https://www.fool.com/earnings/call-transcripts/2026/08/11/mcdonalds-mcd-q2-2026-earnings-call-transcript/
- T4https://www.theglobeandmail.com/investing/markets/stocks/WEN/pressreleases/3852891/wendys-wen-q2-2026-earnings…
- T2https://www.reuters.com/business/finance/pepsicos-turnaround-stutters-americans-rethink-snacking-2026-07-14/
- T4https://www.qsrweb.com/articles/the-next-generation-of-qsr-part-1-the-new-economics-of-value/
- T4https://www.investing.com/news/transcripts/earnings-call-transcript-mcdonalds-q1-2026-beats-forecasts-stock-ri…
- T4https://finance.yahoo.com/quote/MDOD.XC/earnings/MDOD.XC-Q2-2026-earnings_call-662377.html
- T4https://www.fool.com/earnings/call-transcripts/2026/05/07/mcdonalds-mcd-q1-2026-earnings-transcript/
- T4https://www.investing.com/equities/mcdonalds-news
- T2https://www.reuters.com/business/mcdonalds-outlines-85-billion-plan-support-franchisees-2026-09-23/
- T4https://eciks.org/27999-mcd-stock-investor-day
- T4https://www.perplexity.ai/finance/MCD
- T4https://finance.yahoo.com/markets/stocks/articles/mcdonald-free-fall-continues-wall-134041835.html
- T4https://www.benzinga.com/analyst-stock-ratings/initiation/26/09/61821171/mcdonalds-may-focus-on-menu-innovatio…
- T4https://www.barchart.com/story/news/4751966/dear-mcdonalds-stock-fans-mark-your-calendars-for-september-23
- T4https://stockanalysis.com/stocks/mcd/transcripts/662377-q2-2026/
Earlier and later calls on MCD
- Oct 20, 2026Momentum trap — timing trap, not value trap.Lean bearishview changed
- Oct 9, 2026Cheap, but not yet cleared.Lean bullish
- Oct 6, 2026Oversold reset — cautiously attractive.Lean bullish
- Oct 6, 2026Oversold derating — lean bullish into Q3.Lean bullish
- Sep 23, 2026Dipped, yes. Undervalued, probably.Lean bullish
- Sep 6, 2026Yes, cautiously — it's a show-me buy.Lean bullish
Want a fresh look at MCD, or another name?
Queue a new deep-research run. Published to the feed when done.
Automated research opinion, published as-is on Sep 23, 2026. Not personalised advice. Figures use end-of-day closes.