Oversold derating — lean bullish into Q3.
Thesis
Bull case
At 17.5x forward — below the recent 19-21x forward range — the market has pre-paid for deterioration that hasn't shown up in estimates (FY26 consensus still up from $12.20 to $12.89). The $8.5B franchisee package, funded by a 46% operating margin model, is a traffic-recovery weapon thin-margin competitors can't match; MCD executed exactly this playbook in 2024-25. Beta 0.41, RSI ~17, and a 52-week-low tape mean a merely in-line Q3 with stabilizing U.S. comps likely triggers a sharp relief re-rating toward 19-20x (~$245-260), while the defensive characteristics limit beta to further market downside.
Bear case
The derating is justified because the headwinds are structural and compounding: GLP-1 households cut QSR spend 5-9% and penetration is rising; MCD's core low-income cohort is under the most stress with confidence at a 12.5-year low; and peer results prove MCD is losing the value war on share, not just suffering an industry downturn — a brand-level problem a price-led response can't fix. The $8.5B package and CEO's public criticism of franchisees reveal a strained system, and the AI-pricing exposé adds regulatory/reputational risk that undermines the value message. If FY27 consensus ($13.82) starts breaking, 17.5x on broken estimates becomes 15x on lower numbers (~$190-200).
What would change our mind
- Q3 2026 U.S. comps ≤0% while YUM/RBI report positive comps — proves brand-level share loss, not industry malaise
- FY2027 consensus EPS cut by more than ~3-5% from $13.82 — turns 'negative at the margin' revisions into estimate collapse
- Regulatory action (FTC/state AG) formally opened into MCD's pricing algorithms
- Evidence the $8.5B package is funding franchisee survival rather than traffic (e.g., unit closures, operator defaults rising)
- Stock breaks decisively below the 52-week low on Q3 results with estimate cuts — signals the market is repricing earnings, not just multiples
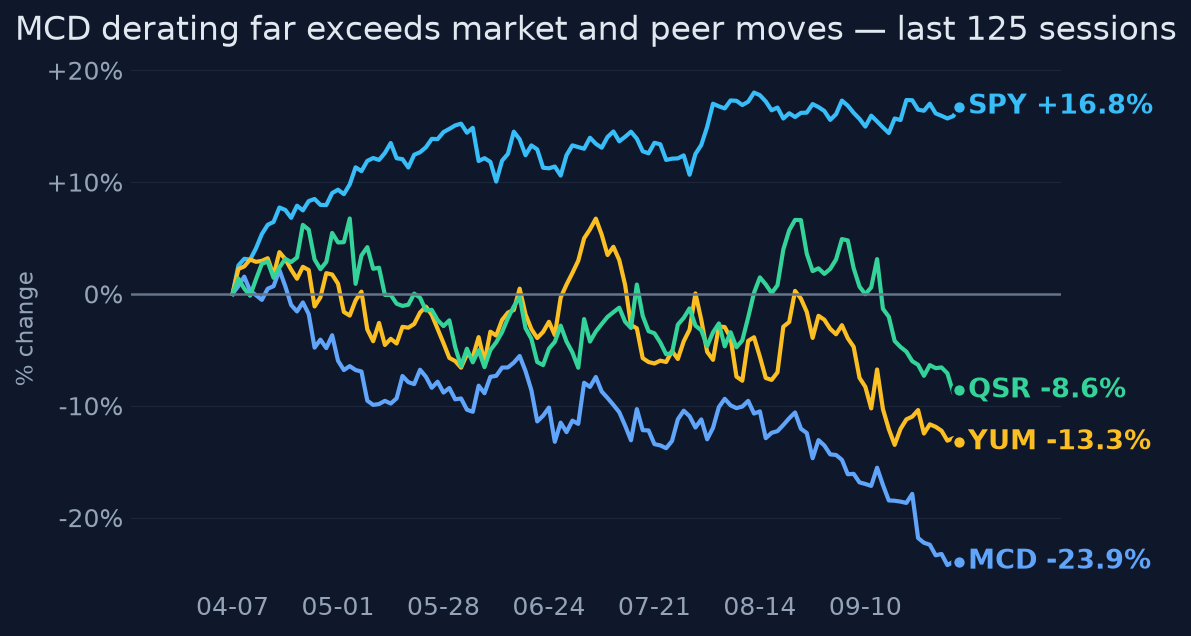
Since publication vs SPY · closed horizons are frozen
The full research everything the view rests on
Direct answer to the question asked
Where the edge would come from
What the price assumes
At 17.5x forward vs ~25x 3-yr average and ~19-21x recent forward range, the price implies a permanently lower growth/margin trajectory: flat U.S. traffic persisting, franchisee economics impaired, and the low-to-mid-50s% 2030 margin target viewed as aspirational. The market is also pricing MCD as a value-war loser — peers YUM (+4% comps ex-Pizza Hut) and RBI (+3.8% comps, +12.9% adj. EPS) are compounding while MCD posts +0.8% U.S. comps.
Why the market may be wrong
Two ways. (1) If Q3 shows U.S. comp inflection while industry traffic stays flat, the Sept 23 'structural' framing was an overreaction and the multiple mean-reverts — MCD has bought traffic back before (2024-25 McValue recovery) and now has an $8.5B package explicitly aimed at it. (2) The $8.5B franchisee support was read as distress; it is better understood as arsenal — a 46%-margin corporate model funding a value war that thinner-margin franchise systems (Wendy's, BK franchisees) cannot match. Consensus FY26 EPS has actually risen from $12.20 to $12.89 over recent months, so the 'estimate collapse' the price implies hasn't happened.
The one thing to watch
Stop watching traffic levels — watch traffic share. Management says industry traffic is flat; YUM and RBI results prove a flat industry can still produce +4% comps for winners. The falsifiable test at Q3 is not whether traffic recovers but whether MCD's comps converge toward peers within a flat industry: if yes, Sept 23 was a sentiment overreaction and the stock re-rates on multiple alone; if MCD comps stay near zero while BK/Taco Bell comp positively, the problem is brand-level share loss and 17.5x is not cheap.
Key evidence (9)
- Q2 2026 (reported Aug 4, 2026): adj. EPS $3.38 vs $3.34 est (beat), revenue ~$7.1B vs $7.14B (slight miss), global comps +1.3%, U.S. comps +0.8%; 50,000-restaurant goal pushed to 2028 [T4 transcripts]
- Sept 23, 2026 investor update: management guided industry traffic in key markets to stay flat with elevated inflation; announced $8.5B decade-long franchisee support package; CEO publicly criticized franchisees over sub-$3 value pricing [Reuters, T2]
- Price action as of Oct 5-6, 2026: $231.89-233.04, -32% from 52-wk high, +0.4% above 52-wk low, -24.5% over 6m vs SPY +17.4%, RSI ~17, 20d vol at 84th percentile, Sharpe(1y) ~ -1.35 [market data]
- Consensus: FY26 EPS $12.89 (+7.9% vs 2025's $11.95), FY27 $13.82; last-30-day revisions ~2 up vs 14-15 down on EPS and revenue for both years [T4 aggregators, Sep 27, 2026 snapshot — magnitudes approximate]
- Valuation: forward P/E ~17.5x vs 3-yr average P/E 24.9x and cited recent forward range 18.9-21.6x [T4; treat levels as approximate]
- Peers Q2 2026: YUM system sales +7%, comps +4% ex-Pizza Hut, digital +25% H1; RBI comps +3.8%, system sales +6.4%, adj. EPS +12.9% with Burger King U.S. outperforming [T4 transcripts]
- GLP-1 evidence: Cornell/Numerator ~8% fast-food spend cut per GLP-1 household; PwC ~8.7% QSR spend decline after 6-8 months; BTIG survey ~70% of users visit restaurants less [T2/T4]
- U.S. consumer confidence near a 12.5-year low in Sept 2026; lower-income households most squeezed [Reuters, T2]
- 2025 fundamentals: record EPS $11.95, operating margin 46.1%; 46.9% YTD adjusted operating margin through Q2 2026 [SEC XBRL / T4]
Catalysts and risks
Catalysts
- Q3 2026 earnings (historically late Oct-early Nov; exact date unverified) — U.S. comps vs. peers is the decisive print
- Monthly/quarterly industry traffic data and any commentary on low-income consumer trends
- Evidence the $8.5B franchisee package is translating into U.S. traffic/value-menu traction
- Escalation or resolution of the AI-pricing story (regulatory inquiry, political attention, or McDonald's clarifications)
- Analyst revision direction after Q3 — whether FY27 $13.82 holds or breaks
Risks
- Q3 shows U.S. comps flat/negative while peers comp positively — confirms share loss and invalidates the mean-reversion setup
- GLP-1 penetration accelerating faster than expected, turning a slow headwind into a visible comp drag
- Low-income consumer deteriorates further (confidence already at 12.5-yr low), hitting MCD's core cohort disproportionately
- Antitrust/regulatory action or consumer backlash on algorithmic pricing
- Franchisee economics worsen despite the support package; system friction becomes public and disruptive
- Key revision and valuation data rests on T4 aggregators — magnitudes may be less precise than cited
What to watch
- MCD U.S. comps vs. YUM/RBI/CMG comps in the same quarter — the traffic-share test
- FY27 EPS revision breadth after Q3 (currently ~2 up vs 15 down; watch for acceleration either way)
- Franchisee health signals: operator commentary, unit economics disclosures, any shift in tone from corporate-franchisee friction
- Regulatory/political headlines on AI or 'surveillance' pricing
- Third-party QSR traffic data (Placer.ai-type) and low-income consumer indicators
- Whether the stock can reclaim the 20d SMA (~$244) — confirmation the oversold condition is resolving
Market snapshot when the call was made 2026-10-05
Price
| Return 1w | -1.9% |
| Return 1m | -11.1% |
| Return 3m | -17.0% |
| Return 6m | -24.5% |
| Return 1y | -22.8% |
| From 52-week high | -32.0% |
| Realized vol, 20d | 21.8% |
| SPY 3m / 1y | +2.4% / +15.1% |
| QQQ 3m / 1y | +6.6% / +24.8% |
Technicals
MCD technicals as of 2026-10-05: last close $233.04; 20d SMA 243.79 (bearish); 50d SMA 258.61; 12d EMA 237.61; 26d EMA 245.72; RSI 14 16.7 (oversold); 20d vol 21.4%; volume x0.9 vs 20d avg
Verifier notes PASS
Weakly sourced
- 'MCD executed exactly this playbook in 2024-25' (McValue traffic recovery) appears only as an uncited assertion in the planner digest, not in any tool result — it is supporting color, not load-bearing, so not material.
Sources (31 · T1 = primary filings)
- T4https://finance.yahoo.com/quote/0R6.F/earnings/0R6.F-Q2-2026-earnings_call-553912.html
- T4https://finance.yahoo.com/quote/0QYD.L/earnings/0QYD.L-Q2-2026-earnings_call-656906.html
- T4https://stockanalysis.com/stocks/yum/transcripts/656906-q2-2026/
- T4https://www.investing.com/news/transcripts/earnings-call-transcript-yum-brands-posts-q2-2026-profit-beat-share…
- T4https://finance.yahoo.com/quote/QSR/earnings/QSR-Q2-2026-earnings_call-553912.html
- T4https://www.marketbeat.com/stocks/NYSE/YUM/earnings/
- T4https://www.roic.ai/quote/0VFA.L/transcripts/2026-year/2-quarter
- T4https://www.gurufocus.com/news/9014325/restaurant-brands-international-inc-qsr-q2-2026-earnings-call-highlight…
- T2https://www.reuters.com/business/mcdonalds-outlines-85-billion-plan-support-franchisees-2026-09-23/
- T4https://capital.com/en-ke/news/mcdonald-s-falls-as-ceo-warns-on-weak-traffic-growth-unveils
- T2https://www.reuters.com/company/mcdonald-s-corp/
- T2https://www.reuters.com/markets/companies/MCD.N/
- T4https://finance.yahoo.com/quote/MCD/earnings/MCD-Q2-2026-earnings_call-662377.html?fr=sycsrp_catchall
- T2https://www.reuters.com/business/inside-mcdonalds-push-have-ai-price-your-big-mac-2026-09-29/
- T4https://www.insidermonkey.com/news/can-mcdonalds-turn-better-restaurant-economics-into-faster-growth-1843147/?…
- T4https://finance.yahoo.com/markets/stocks/articles/mcdonalds-corp-mcd-q2-2026-210447721.html
- T2https://www.reuters.com/info-pages/transcript/b6c26ef8-0ce3-11f1-bae1-cff3dff0408e/
- T2https://www.reuters.com/business/healthcare-pharmaceuticals/many-this-years-super-bowl-features-salad-food-com…
- T2https://www.reuters.com/business/healthcare-pharmaceuticals/weight-loss-pill-approval-set-accelerate-food-indu…
- T4https://in.tradingview.com/news/reuters.com,2025:newsml_L2N3VC0S2:0-weight-loss-drugs-pose-new-challenge-for-u…
- T4https://www.fticonsulting.com/insights/articles/glp-1-drugs-rewriting-rules-food-beverage
- T4https://stockanalysis.com/stocks/qsr/transcripts/
- T2https://www.reuters.com/business/us-consumer-confidence-ebbs-may-inflation-worries-mount-2026-05-26/
- T4https://www.sial-network.com/en/trends/Newsroom/how-GLP-1s-are-reshaping-restaurant-menus
- T2https://www.reuters.com/article/idUSKBN3VF0YQ
- T4https://finance.yahoo.com/technology/ai/articles/mcdonald-ai-pricing-tool-shaping-162850833.html
- T4https://finance.yahoo.com/technology/ai/articles/mcdonald-reveals-ai-helps-set-134041571.html
- T4https://finance.yahoo.com/technology/ai/articles/mcdonald-hits-back-claims-using-185351267.html
- T4https://finance.yahoo.com/technology/ai/articles/mcdonald-ai-pricing-engine-widening-025257931.html
- T4https://nypost.com/2026/09/29/business/mcdonalds-pushes-ai-tools-that-suggest-big-mac-prices-based-on-customer…
- T2https://www.reuters.com/video/watch/idRW524524092026RP1/
Earlier and later calls on MCD
- Oct 20, 2026Momentum trap — timing trap, not value trap.Lean bearishview changed
- Oct 9, 2026Cheap, but not yet cleared.Lean bullish
- Oct 6, 2026Oversold reset — cautiously attractive.Lean bullish
- Sep 23, 2026Dipped, yes. Undervalued, probably.Lean bullish
- Sep 23, 2026Washed out, not broken — lean bullish.Lean bullish
- Sep 6, 2026Yes, cautiously — it's a show-me buy.Lean bullish
Want a fresh look at MCD, or another name?
Queue a new deep-research run. Published to the feed when done.
Automated research opinion, published as-is on Oct 6, 2026. Not personalised advice. Figures use end-of-day closes.